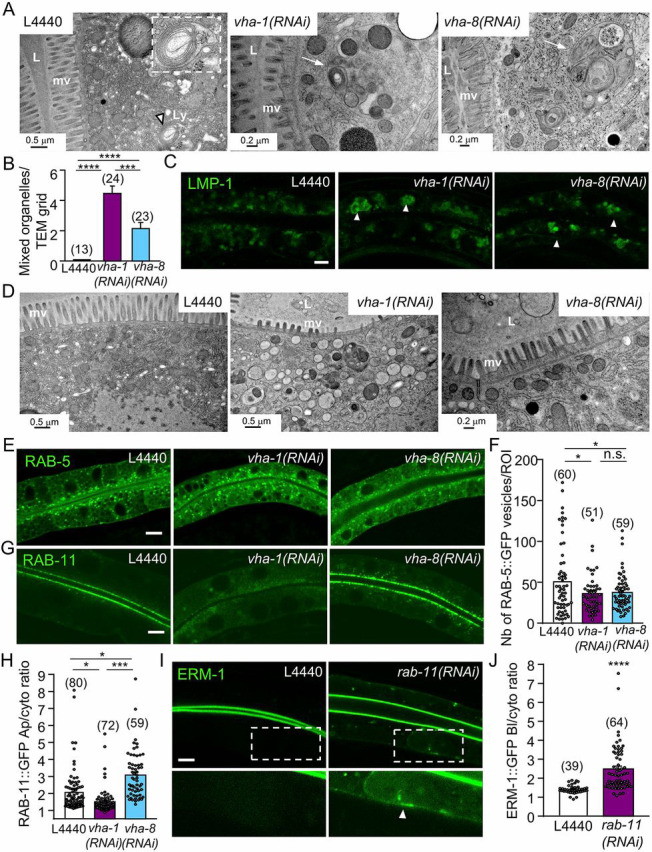
Fig. 2.

V0-ATPase affects apical trafficking via RAB-11 apical recycling endosomes. (A-C) V-ATPase complex silencing affects the morphology of lysosomes. (A) Ultrastructural characterization of transversely sectioned control (L4440), V0/vha-1- or V1/vha-8-depleted worms (72 h RNAi). Whereas lysosomes with normal morphology and size (∼0.5µm) were rarely observed in control worms (left panel, arrowhead and insert), cytoplasmic-enlarged ‘mixed organelles’ with distinct lysosomal and vesicular regions were observed upon either V0/vha-1(RNAi) or V1/vha-8(RNAi) (arrows). (B) Quantification of the number of mixed organelles. Numbers correspond to the total number of TEM grids analyzed (n=1-5 grid/larvae), out of n=7-13 larvae/condition. (C) The accumulation of the lysosomal marker LMP-1::GFP in large cytoplasmic structures (arrowheads) upon both V0/vha-1 and V1/vha-8(RNAi). (D) Ultrastructural characterization of transversely sectioned control (L4440), V0/vha-1- and V1/vha-8-depleted worms (72 h). The middle panel shows the specific and massive accumulation of cytoplasmic electron-lucent vesicles upon V0/vha-1(RNAi). (E-H) V0- or V1-ATPase silencing marginally decreased the number of RAB-5+ vesicles but V0-ATPase knockdown specifically disrupted RAB-11+ apical recycling endosomes. Confocal imaging of the endosomal markers of apical early/sorting (RAB-5, E) and apical recycling (RAB-11, G) endosomes in control, V0/vha-1(RNAi) and V1/vha-8(RNAi) conditions (72 h). (F,H) Quantification of the number of RAB-5+ vesicles (F) and RAB-11 apical/cytoplasmic ratio (H, Mann–Whitney U-test) (n=3). (I-J) rab-11(RNAi) phenocopied V0-ATPase silencing on ERM-1::GFP polarity. ERM-1::GFP-expressing worms were silenced for rab-11 for 72 h and then imaged. Arrowheads show the basolateral accumulation of ERM-1. (J) ERM-1 basolateral/cytoplasmic ratio quantification (n=3). In all micrographs, worms are at the L4/young adult developmental stage. Histograms are mean±s.e.m.; on each panel, dots represent individual worms and the total number of worms is indicated in brackets (except B). L, lumen; mv, microvilli; Ly, lysosome. n.s., nonsignificant, *P<0.05, ***P<0.001, ****P<0.0001. Scale bars: 0.2 µm or 0.5 µm in A,D; 5 µm in C,E,G,I.
