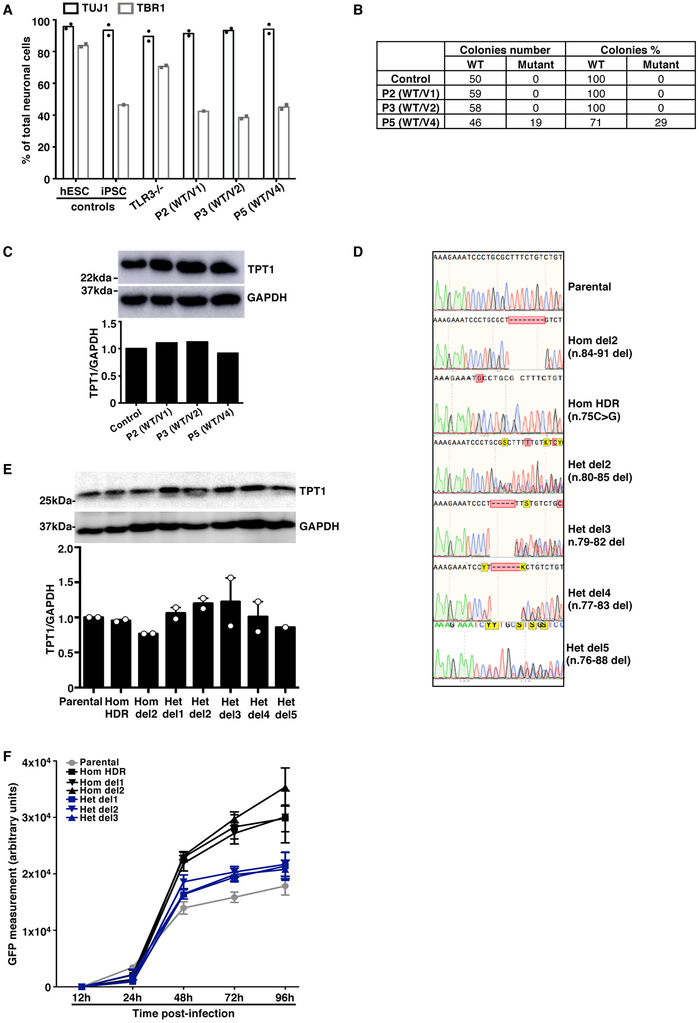
Extended Data Fig. 5. Characterization of CNS neurons derived from patient iPSCs and isogenic hESCs.
A) Quantification of the proportion of neurons among total neuronal cells, based on immunostaining, for control hESC- and control iPSC-derived CNS neurons (H9 and J2) and for CNS neurons derived from the patients’ iPSCs. Results from technical duplicates from one experiment are shown, representative of n=3 neuron differentiations per line (H9, J1, J2 control lines, and iPSC lines from P2, P3 and P5). B) Sequencing results for the SNORA31 cDNA obtained from the patients’ iPSC-derived neurons, after cloning in E. coli. The number of individual WT or mutant colonies detected by sequencing is indicated on the left side of the table, whereas the corresponding percentage is indicated on the right. C) Levels of TPT1 protein, encoded by the host gene of SNORA31, in control (H9 hESC) and patient iPSC-derived neurons, as assessed by western blotting. GAPDH was used as a loading control. Results of semi-quantification of TPT1 expression levels relative to GAPDH are shown in the lower panel. The data presented are representative of n=2 independent experiments. D) Histogram representation of the CRISPR-Cas9-introduced homozygous or heterozygous SNORA1 mutations (hom del2 n.84-91, hom HDR n.75C>G, het del2 n.80-85, het del3 n.79-82, het del4 n.77-83, het del5 n.76-88), confirmed by Sanger sequencing on genomic DNA from the gene-edited hESC lines. Sequencing results from the parental line is also shown. E) Levels of TPT1 protein, encoded by the host gene of SNORA31, as measured by western blotting (upper panel), in CNS neurons derived from isogenic hESCs carrying a homozygous HDR-introduced patient-specific point mutation (hom HDR), a homozygous deletion (hom del1 or hom del2), or various heterozygous mutations (het del1, het del2, het del3, het del4, het del5) in SNORA31. GAPDH was used as a loading control (lower panel). The data presented are representative of n=3 independent experiments, with n=1 biological replicate tested per condition per experiment. Semi-quantification of TPT1 band density relative to GPADH was performed and the data are shown in the lower panel. F) Quantification of HSV-1 in isogenic hPSC-derived CNS neurons, at various time points after HSV-1 infection at a MOI of 1, as assessed by measuring GFP-capsid expression. Four healthy control lines were used in these experiments: two control hESC lines and two control iPSC lines. Means and standard deviations from n=3 independent experiments are shown.

