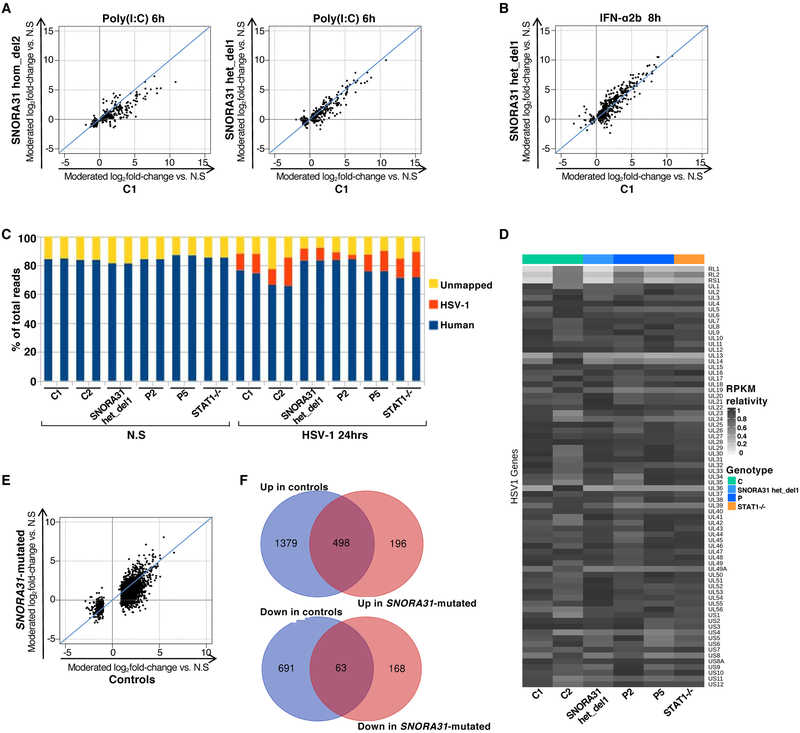
Extended Data Fig. 6. Transcriptome responses to stimulation with poly(I:C), IFN-α2b or HSV-1 in SNORA31-mutated hPSC-derived cortical neurons.
A, B) Scatter plots of fold-changes in RNA-Seq-quantified gene expression following stimulation with 25 μg/ml poly(I:C) for 6 hours (A) or 100 IU/ml IFN-α2b for 8 hours (B), in hPSC-derived cortical neurons from one healthy control H9 hESC line (C1) versus one isogenic SNORA31-mutated line (hom del2 or het del1). Moderated fold-changes are expressed relative to the corresponding mock-treated samples. Each point represents a single gene, and each plot includes genes identified as differentially expressed (FDR<=0.05) in response to the indicated stimulus relative to non-stimulated (N.S) samples in the isogenic control or SNORA31-mutated line. C) Transcriptome composition analysis of RNA-Seq-quantified gene expression, in hPSC-derived cortical neurons from healthy controls (C1 and C2), an isogenic SNORA31-mutated line, SNORA31-mutated patients (P2 and P5), and a STAT1−/− patient, with or without 24 hours of infection with HSV-1 at a MOI of 1. D) Heatmap of RNA-Seq-quantified HSV-1 transcript expression (RPKM relativity) in hPSC-derived cortical neurons from healthy controls (C1 and C2), SNORA31-mutated patients (P2 and P5), an isogenic SNORA31-mutated hESC line (het del1), and a STAT1−/− patient, following infection with HSV-1 for 24 hours at a MOI of 1. E) Scatter plot of averaged log2 fold-changes in gene expression by 24 hours of HSV-1 infection, in two healthy controls (C1, C2) versus hPSC-derived cortical neurons from three SNORA31-mutated lines (patient-specific lines from P2 and P5, and an isogenic SNORA31-mutated hESC line, SNORA31 het del1). Moderated fold-changes are expressed relative to the corresponding mock-treated samples. Each point represents a single gene, and the plot includes genes identified as differentially expressed (FDR<=0.05, >2-fold difference) in response to the indicated stimulus relative to N.S samples in the healthy control or SNORA31-mutated groups. F) Number of human transcripts up- or downregulated by HSV-1 infection in either or both of control (C1 and C2) and SNORA31-mutated (P2 and P5, and isogenic SNORA31 het del1 line) hPSC-derived cortical neurons.

