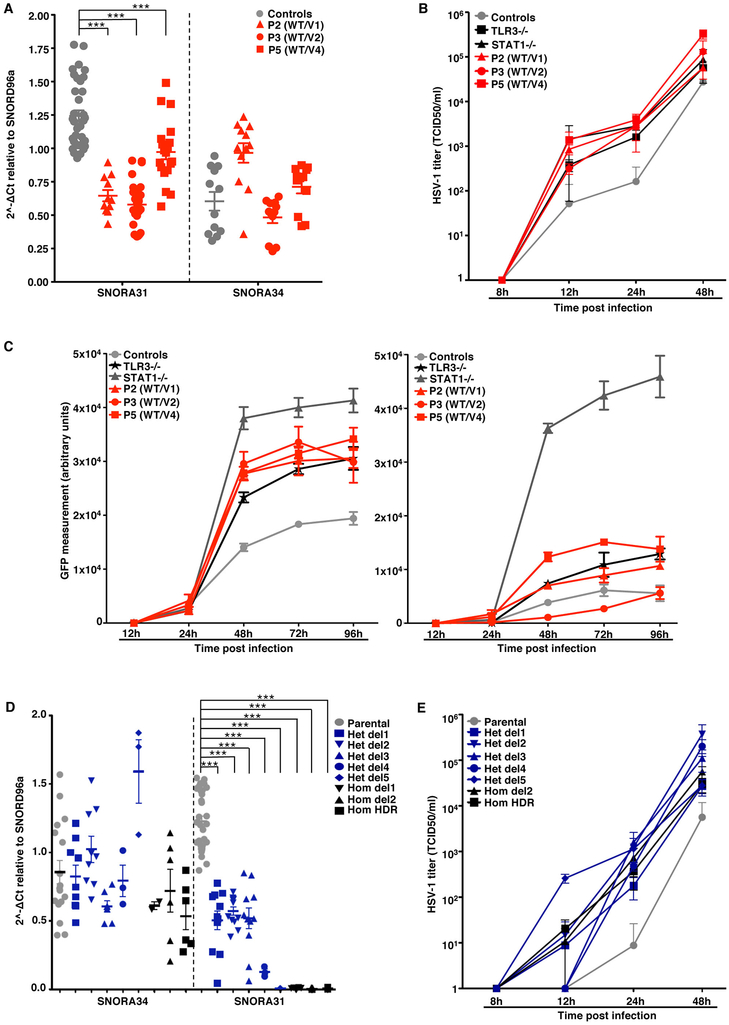
Figure 5. Cellular phenotypes in CNS neurons derived from patient iPSCs and isogenic hESCs.
A) Expression of SNORA31 and SNORA34, as measured by RT-qPCR in hPSC-derived CNS neurons for patients (P2, P3, P5) and controls. Four healthy control lines were used in the experiments: two control hESC lines and two control iPSC lines. Means and standard deviations from three independent experiments are shown. Each point represents one biological replicate, with n=3 (control lines) n=4 (P2), n=8 (P3) or n=6 (P5) biological replicates per cell line tested for snoRNA31 expression per experiment. Mean values were compared for SNORA31 expression between control cells and cells from the patients, in one-way ANOVA (F=50.84, total df=89)) followed by Dunnett’s multiple comparison tests. ***, p<0.001. B) Quantification of HSV-1 in CNS neurons derived from control and patient hPSCs, at the indicated times post infection at a MOI of 0.001, as quantified by the TCID50 virus titration method. TLR3−/− and STAT1−/− cells, which are highly susceptible to HSV-1, were used as controls. Means and standard deviations from n=3 independent experiments are shown. N=1 biological replicate was tested per condition per experiment. C) HSV-1 abundance was assessed by measuring GFP-capsid expression in iPSC-derived CNS neurons from patients (P2, P3, P5), a TLR3−/− patient and a STAT1−/− patient, and four healthy control lines. Measurements were made at the indicated times post infection with a MOI of 1, without (left) or with (right) IFN-β pretreatment for 16 hours. Means and standard deviations from n=3 independent experiments, with n=3 biological replicates for each set of conditions in each experiment, are shown. D) SNORA31 and SNORA34 expression in CNS neurons derived from gene-edited isogenic hESCs (blue and black dots) and the parental line hESCs (grey dots). Means and standard deviations from n=3 independent experiments are shown. Each point represents one biological replicate, with n=10 (for parental line), n=1 (het del4, het del5), n=2 (hom del1), n=3 (hom del2) or n=4 (het del1, het del2, het del3, hom HDR) biological replicates per genotype tested per experiment. Mean values were compared for SNORA31 expression between SNORA31-mutated and parental cells, in one-way ANOVA (F=106.6, total df=101) followed by Dunnett’s multiple comparison tests. ***, p<0.001. E) Quantification of HSV-1 in CNS neurons derived from isogenic hESCs, either WT (parental), or carrying a homozygous HDR-introduced patient-specific point mutation (hom HDR), a homozygous deletion (hom del2), or various heterozygous mutations (het del1, het del2, het del3, het del4, het del5) in SNORA31. HSV-1 levels were quantified at the indicated times post infection at a MOI of 0.001. HSV-1titers were determined by the TCID50 method. For the hom HDR, hom del2, het del1, het del2 and het del3 lines, means and standard deviations from n=3 independent experiments, with n=1 biological replicate in one experiment and n=2 biological replicates in two experiments for each set of conditions, are shown. For the het del4 and het del5 lines, the mean and standard deviation for n=3 biological replicates from n=4 independent experiments are shown.

