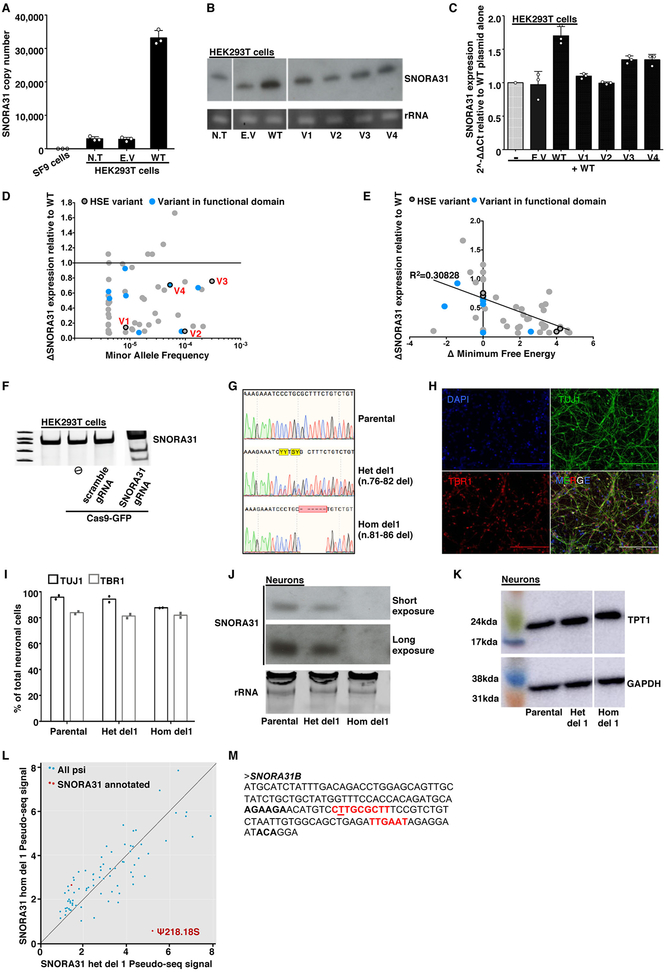
Extended Data Fig. 2. Expression of WT and mutant SNORA31 in HEK293T cells and in isogenic hESC-derived neurons.
A) Quantification, by qPCR, of SNORA31 copy numbers in 293T cells transfected with an empty plasmid or a plasmid containing the WT sequence of SNORA31. Copy numbers were calculated from a standard curve. Insect SF9 cells were used as a negative control in this experiment as they contain no SNORA31 homolog. N.T: not transfected. E.V: empty vector. Means and standard deviations from n=3 independent experiments are shown. B) Northern blot of SNORA31 in HEK293T cells either not transfected or transfected with an empty vector or a vector containing WT or mutant SNORA31. Cropped images from the same blot are shown. The data presented are representative of n=2 independent experiments. C) RT-qPCR quantification of the fold-change in SNORA31 expression in HEK293T cells. Cells were transfected with a vector containing WT SNORA31 alone or cotransfected with the same amount of empty vector and a vector containing the WT or one of the HSE SNORA31 mutant sequences. The data are expressed relative to SNORD96a expression and normalized relative to the expression of SNORA31 in HEK293T cells transfected with WT SNORA31 vector alone. Means and standard deviations from n=3 independent experiments are shown. D) Plots of the relative expression levels of gnomAD SNORA31 mutant alleles (normalized relative to WT SNORA31 expression level) against minor allele frequency in gnomAD. RT-qPCR quantification of gnomAD SNORA31 mutant allele expression in HEK293T cells transfected with vectors containing each of the mutant alleles. The data are expressed relative to the expression of endogenous SNORD96a and normalized relative to that of SNORA31 in cells transfected with a plasmid carrying the WT sequence. The expression levels of each gnomAD variant were assessed in n=2 independent experiment, and the mean value for each variant is shown as a dot. E) Plot of the relative levels of expression of gnomAD SNORA31 mutant alleles (normalized relative to WT SNORA31 expression levels) against their calculated change in minimum free energy. The expression levels of each gnomAD variant were assessed in n=2 independent experiment, and the mean value for each variant is shown as a dot. F) Surveyor assay for full-length SNORA31 PCR in HEK293T cells transfected with Cas9-GFP vector alone (⦸) or together with a scrambled guide RNA (gRNA) vector, or a SNORA31 gRNA vector. The data shown is representative of data from n=2 independent experiments. G) Histogram representation of the CRISPR-Cas9-introduced homozygous or heterozygous SNORA1 mutations (het del1 n.76-82, hom del1 n.81-86), confirmed by Sanger sequencing on genomic DNA from the gene-edited hESC lines. Sequencing results from the parental line is also shown. H) Demonstration of the CNS cortical identity (TBR1-positive) of neurons (TUJ1-positive) differentiated from the hESC control line H9. The images shown are representative of data from n=6 independent experiments. I) Quantification of the proportion of cortical neurons among total neurons based on the immunostaining of parental and gene-edited hESCs harboring either a heterozygous (het del1) or a homozygous (hom del1) deletion in SNORA31. Results from technical duplicates from a single experiment are shown, representative of n=3 independent neuron differentiations for each line. J) Northern blot of SNORA31 expression in isogenic hESC-derived CNS neurons. SNORA31 expression in parental cells is compared to that in cells carrying heterozygous del 1 (het del1) or homozygous del 1 (hom del1) in the genomic sequence of SNORA31. The data presented are representative of n=2 independent experiments. K) Levels of TPT1 protein, encoded by the host gene of SNORA31, as assessed on western blots for isogenic CNS neurons. Cropped images from the same blot are shown. GAPDH was used as a loading control. The data are representative of n=2 independent experiments. L) Pseudouridylation data obtained by pseudo-seq. Each point represents a pseudouridylation site. Mean values from n=4 libraries each for the parental and het del1 lines and n=3 libraries for the hom del1 line are shown. M) Genomic sequence of SNORA31B. The guide sequences for this putative snoRNA gene are highlighted in red.

