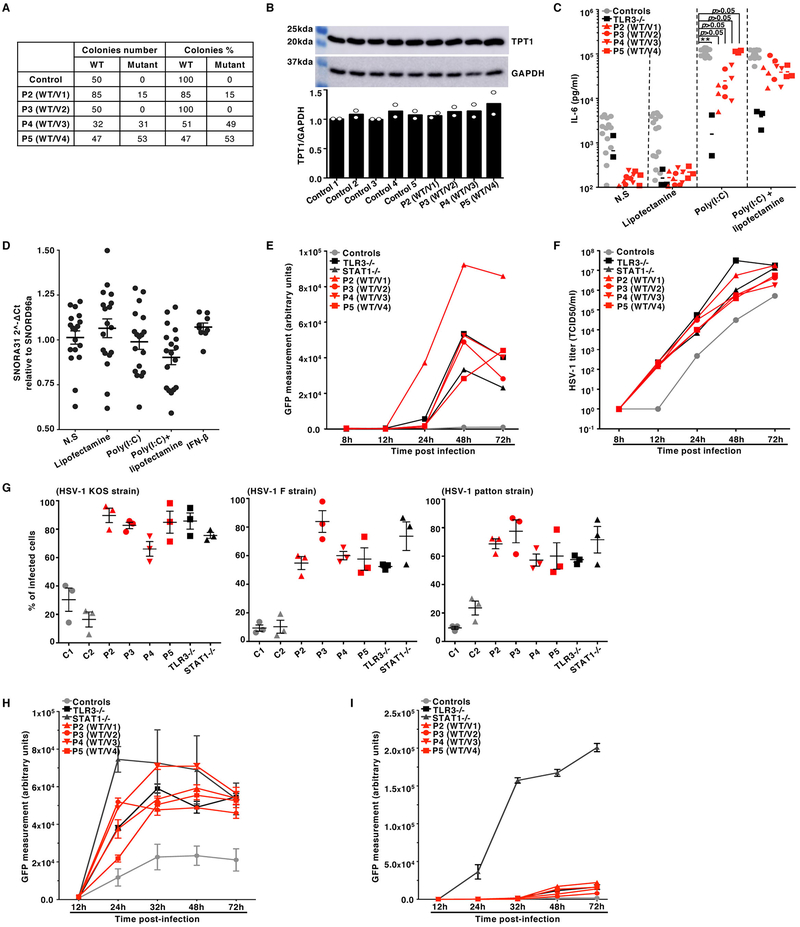
Extended Data Fig. 3. Cellular phenotypes of the SV40-fibroblasts of patients with SNORA31 mutations.
A) Sequencing results for SNORA31 cDNA from the SV40-fibroblasts of four patients (P2-P5), after cloning in E. coli. The number of individual WT or mutant colonies detected by sequencing is indicated on the left of the table, whereas the corresponding percentage is indicated on the right. B) Levels of TPT1 protein (upper panel), encoded by the host gene of SNORA31, in the patient and control SV40-fibroblasts, as measured by western blotting. GAPDH was used as a loading control (middle panel). The data presented are representative of n=2 independent experiments. Semi-quantification of TPT1 band density relative to GPADH was performed and the data are shown in the lower panel. C) IL-6 production in SV40-fibroblasts from patients (P2-P5), a TLR3−/− control, and five healthy controls, as measured by ELISA, in the supernatant of control and patient SV40-fibroblasts stimulated with 25 ng/mL poly(I:C) alone, Lipofectamine alone, or both. TLR3−/− cells were used as a negative control for the poly(I:C) response. N.S: not stimulated. N=3 independent experiments were performed, with n=1 biological replicate per cell line tested per experiment. Each point represents one biological replicate. The means of the three independent experiments are shown. The levels of IL-6 production upon poly(I:C) stimulation are compared between controls’ and patients’ cells, in one way ANOVA (F=1.403, total df=29) followed by Dunnett’s multiple comparison tests. ** 0.001<p<0.01. D) Relative expression levels for SNORA31, as determined by RT-qPCR after stimulation with poly(I:C) or IFN-β in control SV40-fibroblasts. The data are expressed relative to SNORD96a expression. N=3 independent experiments were performed, with n=3 (for IFN-β stimulation) or n=6 (all other conditions) biological replicates tested per experiment. Each point represents one biological replicate. Means and standard deviations from three independent experiments are shown. E, F) HSV-1 (strain KOS) abundance, as determined by measurements of GFP-capsid expression in SV40-fibroblasts at the indicated time points post infection with a MOI of 0.01 (E) followed by measurements of the corresponding titers, as determined by calculating the 50% end point (TCID50) in Vero cells (F), for four SNORA31-deficient patients (P2-P5), a TLR3−/− patient and a STAT1−/− patient as susceptible controls, and two healthy controls. Mean values from n=2 independent experiments are shown. N=1 (for TCID50 assay) or n=3 (for measurement of GFP-capsid expression) biological replicates were tested per condition per experiment. G) Percentage of patient and control SV40-fibroblasts producing capsids 24 hours post infection with HSV-1 strain KOS (left), F (middle) or Patton (right) at a MOI of 3 (based on titers measured on Vero cells). Means and standard deviations of n=3 independent experiments are shown. N=1 biological replicate was tested per condition per experiment. H, I) HSV-1 (strain KOS) abundance, as determined by measurements of GFP-capsid expression in patient (P2-P5) and control SV40-fibroblasts at the indicated time points following infection at a MOI of 0.1, without (H) and with (I) IFN-β pretreatment for 16 hours. STAT1−/− cells were used as a control with no IFN-β response. Means and standard deviations from n=3 independent experiments are shown. N=3 biological duplicates were tested per condition per experiment.

