Figure 3.
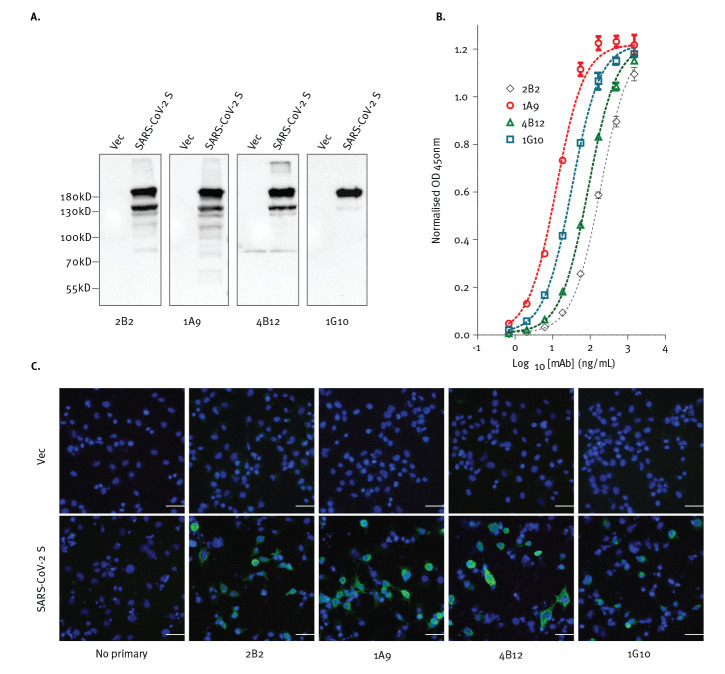
Antibodies expected to target SARS-CoV-2 S protein, (A) hybridise to the denatured protein in western blot, (B) bind to the protein in ELISA and (C) recognise cells expressing the protein as shown by immunofluorescence
DAPI: 4′,6-diamidino-2-phenylindole; mAb: monoclonal antibody: OD: optical density; SARS-CoV-2: severe acute respiratory syndrome coronavirus 2; S protein: spike protein; vec: pXJ40-Myc expression vector used as an empty vector control.
A. Each photo depicts a western blot using the primary antibody indicated below it (2B2, 1A9, 4B12, or 1G10). Empty vector-transfected 293FT cell products are on the lanes labelled as ‘Vec’, while products of 293FT cells expressing full-length SARS-CoV-2 S protein are on the lanes labelled ‘SARS-CoV-2 S’. Primary antibodies were labelled with horseradish peroxidase-conjugated secondary antibodies. A ladder indicative of the molecular weights in kD of the proteins relative to their vertical position on the blots, is indicated on the left of the panel.
B. The abilities of 2B2, 1A9, 4B12 and 1G10 monoclonal antibodies to bind to SARS-CoV-2 S protein was determined by ELISA. Individual wells were coated with 20 ng of SARS-CoV-2 S protein and incubated with serially diluted mAbs as indicated. A representative plot from three independent experiment is show for each antibody and error bars correspond to standard deviations of each mAb experiment carried out in triplicates.
C. Each photo depicts an immunofluorescence assay using either no primary antibody, or the primary antibody indicated below it (Myc, 2B2, 1A9, 4B12, or 1G10). Immunofluorescence analysis was performed on empty vector-transfected COS-7 cells (top photos) and cells expressing full-length SARS-CoV-2 S protein (bottom photos). The indicated primary antibodies were used followed by Alexa Fluor 488-conjugated secondary antibody (green). Cell nuclei were counterstained with DAPI (blue). Scale bar = 50 µm.

