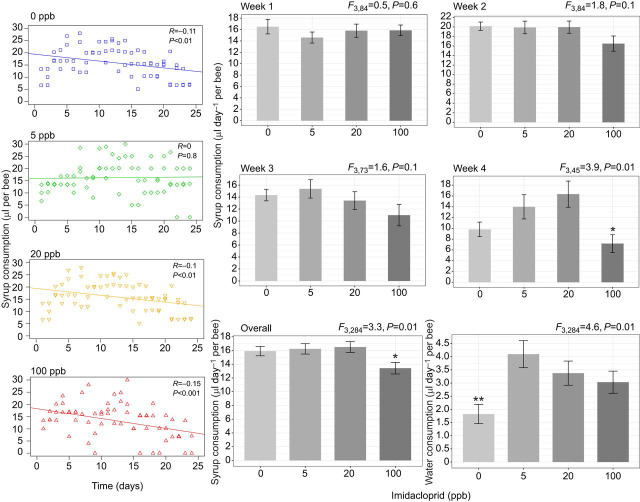
Fig. 2.
Syrup consumption of treatment groups during the 24 day experiment. Left, scatterplots showing daily syrup consumption and Pearson correlation coefficient (R) are provided for each treatment category. Right, weekly and overall syrup intake and water intake calculated per treatment. ANOVA was conducted at a 95% confidence level and error bars represent the s.e.m. (*P<0.05; **P<0.01).

