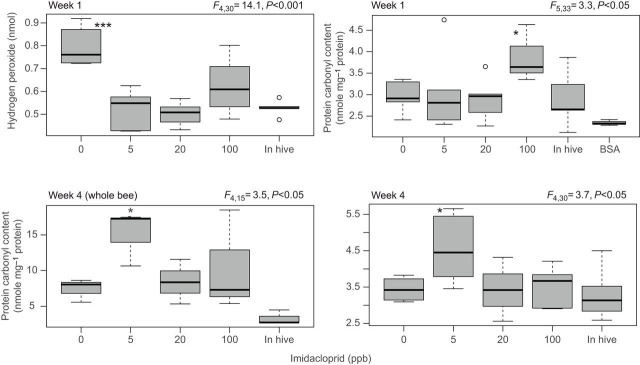
Fig. 4.
Quantification of hydrogen peroxide and protein carbonyl content in caged and hive bees. The hydrogen peroxide assay was conducted on bees sampled at week 1 and the protein carbonyl assay was conducted on bees at week 1 and 4. Each boxplot represents an average of six biological replicates. Bovine serum albumin (BSA) data were not included in the statistical analysis. Error bars are quartiles and outliers; ANOVA levels of significance are *P<0.05 and ***P<0.001.

