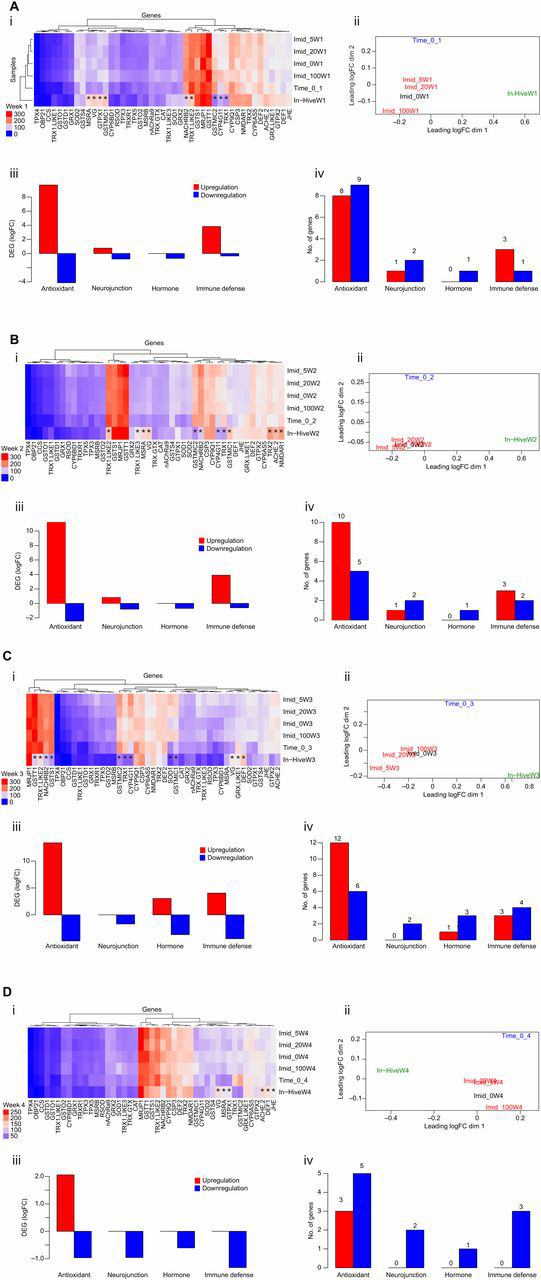
Fig. 5.

Honey bee gene regulation. (A–D) Data for weeks 1–4, respectively. (i) Heatmap of all samples and target genes (45) using moderated log counts per million. Asterisks represent genes differentially expressed in hive bees. (ii) Multi-dimensional scaling (MDS) or biological coefficient of variance of the samples based on the log fold-change (logFC) between each pair of RNA samples. (iii,iv) Data sorted by gene function for differential gene expression studies (DEG; iii) and the number of genes regulated (iv) in caged bees compared with hive bees in week 1.
