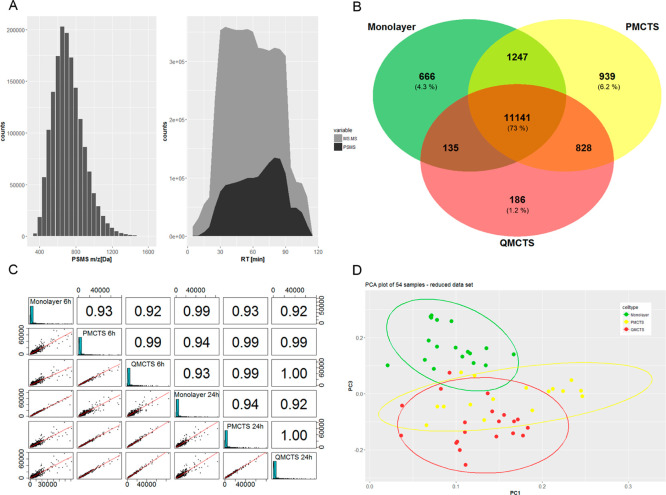
Figure 1.
Quality control analysis and data assessment of bottom-up quantitative proteomics. (A) Mass range coverage and distribution of the obtained MS/MS spectrum information (5174157) and resulting PSMS (1594878) throughout the gradient. (B) Venn diagram of the whole data set comparing the proteome of the three cell types (including isoforms). Proteins present across 60% of the samples for each cell type were included in the analysis. (C) Reproducibility of the measured absolute protein abundances for the control set data is presented, where each row/column depicts a control (DMSO treated) sample (Pearson correlation coefficient > 0.9). (D) PCA (PC1, PC3) of quantified proteins throughout the whole data set after removal of outliers.

