Fig. 2.
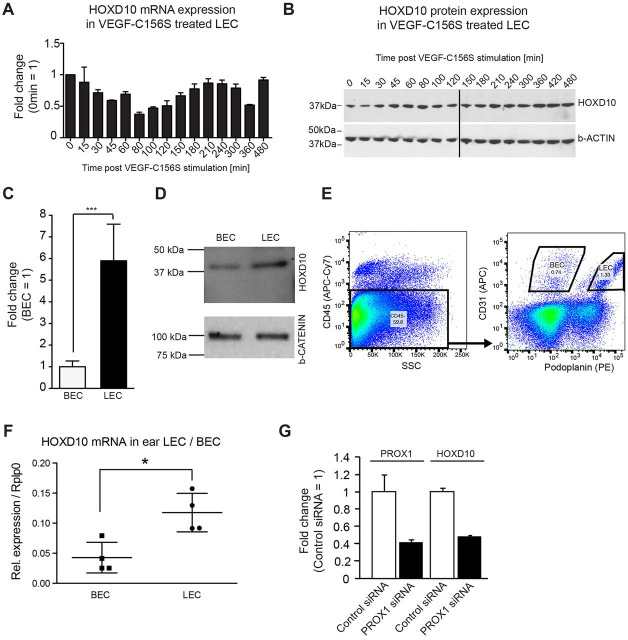
HOXD10 is expressed at a higher level in LECs compared to BECs. (A) qPCR showing the expression levels of HOXD10 after VEGF-C156S stimulation of LECs. (B) Western blot analysis for HOXD10 protein and β-actin as loading control in the same samples used in A. (C) HOXD10 expression was higher in LECs than in BECs as measured by qPCR. Bars represent means±s.d. (pooled data from three independent experiments). ***P<0.001 (Student's t-test). (D) Western blot showing HOXD10 protein levels in LECs and BECs. (E) Representative FACS plot to illustrate the gating strategy for sorting of primary LECs and BECs from mouse ears. (F) qPCR showing increased HOXD10 expression in freshly isolated mouse LECs compared to BECs. Results are mean±s.d. (n=4). *P<0.05 (Student's t-test). (G) qPCR of PROX1 and HOXD10 expression levels in LECs. After siRNA-mediated PROX1 knockdown, HOXD10 expression levels are similarly decreased. Bars represent mean±s.d. (a representative experiment with three technical replicates out of four total experiments shown).

