Fig. 6.
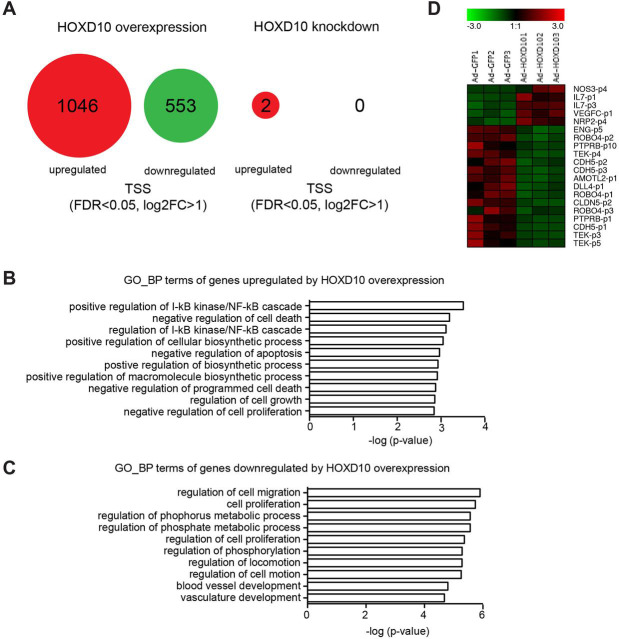
RNA sequencing of LECs after knockdown or overexpression of HOXD10. LECs were infected with adenovirus to knockdown or overexpress HOXD10, and RNA was extracted and subjected to CAGE RNA sequencing 24 h later. (A) Summary of the results: HOXD10 overexpression resulted in the significant (FDR<0.05, log2FC>1) upregulation of 1046 TSS and downregulation of 553 TSS. Knockdown of HOXD10 had only minor effects on unstimulated LECs (upregulation of 2 TSS). (B,C) Gene ontology analysis of genes associated with upregulated (B) and downregulated (C) TSS in HOXD10-overexpressing LECs. The ten most significantly enriched ‘biologic process’ (GO_BP) terms are shown. (D) Heat map of selected TSS differentially expressed in HOXD10-overexpressing cells, whose associated genes have been linked to endothelial biology previously. A number after a p indicates different TSS within the same genes.

