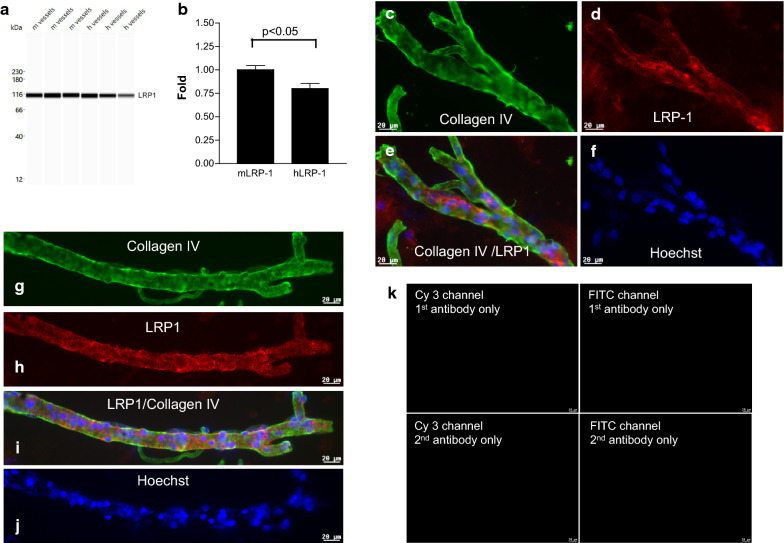
Fig. 6.
LRP-1 protein expression in isolated brain micrvessels (BMVs). a Wes™ band density of LRP-1 expression in human (h) and mouse (m) BMVs. b Quantification of LRP1 expression by Wes™. LRP-1 in each lane is normalized to β-actin in the same lane; the fold-change of human LRP-1 is relative to mouse LRP-1 (set as one). Bars are mean ± SD of three biological replicates. The level of mLRP-1 is significantly higher than hLRP-1 (p < 0.05; unpaired two-tailed t-test). c–f Collagen IV (green) and LRP-1 (red) immunofluorescence in human BMV. g–i Collagen IV (green) and LRP-1 (red) immunofluorescence in mouse BMV. j Nuclei are stained with Hoechst (blue). k Negative controls for G-J. The scale bar is 20 µm

