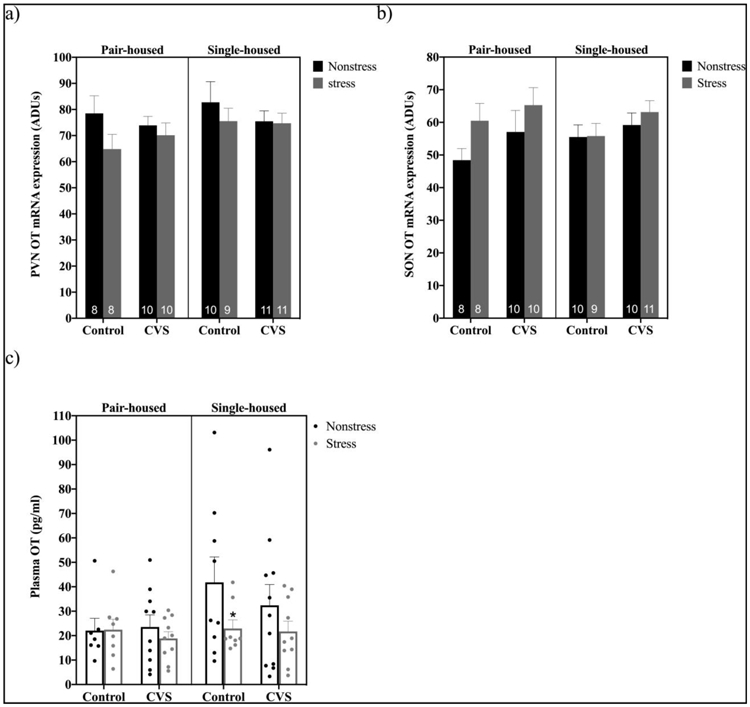
Figure 5.

Levels of hypothalamic oxytocin (OT) mRNA and plasma OT at baseline and after 20 minutes of restraint stress in pair- versus single-housed male mice exposed to chronic variable stress (CVS) or control conditions. Panels a and b show mean ± SEM arbitrary density units (ADUs) calculated from in situ hybridization autoradiograms of OT mRNA within the paraventricular nucleus (PVN) (a) and supraoptic nucleus (SON) (b). Panel c shows mean ± SEM plasma OT levels in pair- versus single-housed mice. *= p<0.05 for stressed versus nonstressed control single-housed males. Numbers within each bar indicate the number of animals used for each group.
