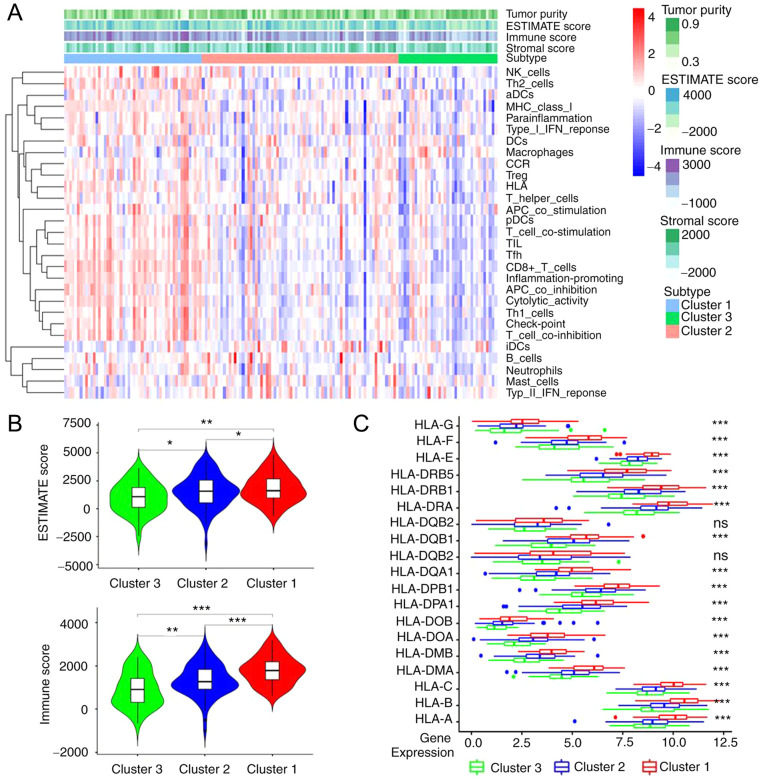
Figure 5.
Different immune characteristics of immune clusters. (A) Tumour purity, stromal score and immune score in different immune clusters were evaluated by ESTIMATE analysis. Different colours indicate different percent of purity. The red and blue colour used on the heatmap indicate the high and low relative activity of immune cells, respectively. (B) Comparison of ESTIMATE score and immune score between immune clusters. (C) Comparison of HLA gene expression levels between immune clusters by ANOVA test. *P<0.05, **P<0.01, ***P<0.001. HLA, human leukocyte antigen; ns, not significant.

