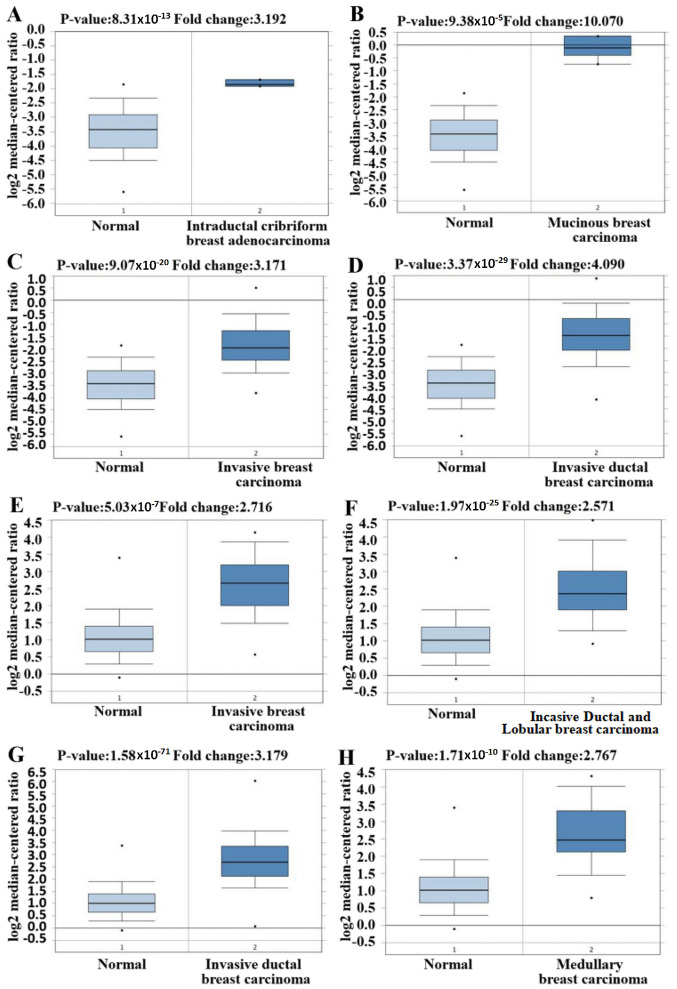
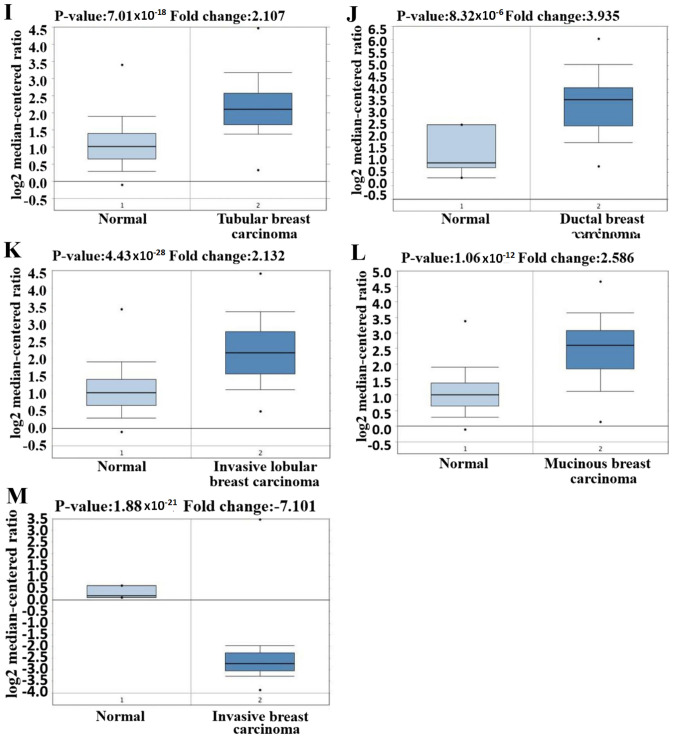
Figure 2.
GINS2 expression in different studies and different types of breast cancer using the Oncomine database. (A-M) Box plots of GINS2 expression comparing different subtypes of breast cancer and normal tissues using the Oncomine database. Upregulated mRNA expression of GINS2 in TCGA datasets of (A) intraductal cribriform breast adenocarcinoma (P=8.31×10⁻¹³); (B) mucinous breast carcinoma (P=9.38×10⁻⁵); (C) invasive breast carcinoma (P=9.07×10⁻²⁰); (D) invasive ductal breast carcinoma (P=3.37×10⁻²⁹). Upregulated mRNA expression of GINS2 in the Curtis breast datasets of (E) invasive breast carcinoma (P=5.03×10⁻⁷); (F) invasive ductal and invasive lobular breast carcinoma (P=1.97E-25); (G) invasive ductal breast carcinoma (P=1.58×10−71); (H) medullary breast carcinoma (P=1.71×10⁻¹⁰). GINS2 expression in different studies and different types of breast cancer using the Oncomine database. (A-M) Box plots of GINS2 expression comparing different subtypes of breast cancer and normal tissues using the Oncomine database. Upregulated mRNA expression of GINS2 in the Curtis Breast dataset of (I) tubular breast carcinoma (P=7.01×10⁻¹⁸); (J) upregulated mRNA expression of GINS2 in the Richardson Breast2 dataset of ductal breast carcinoma (P=8.32×10⁻⁶); (K) invasive lobular breast carcinoma (P=4.43×10⁻²⁸); (L) mucinous breast carcinoma (P=1.06×10⁻¹²); (M) downregulation mRNA expression of GINS2 in the Finak dataset of invasive breast carcinoma, (P=1.88×10⁻²¹).


