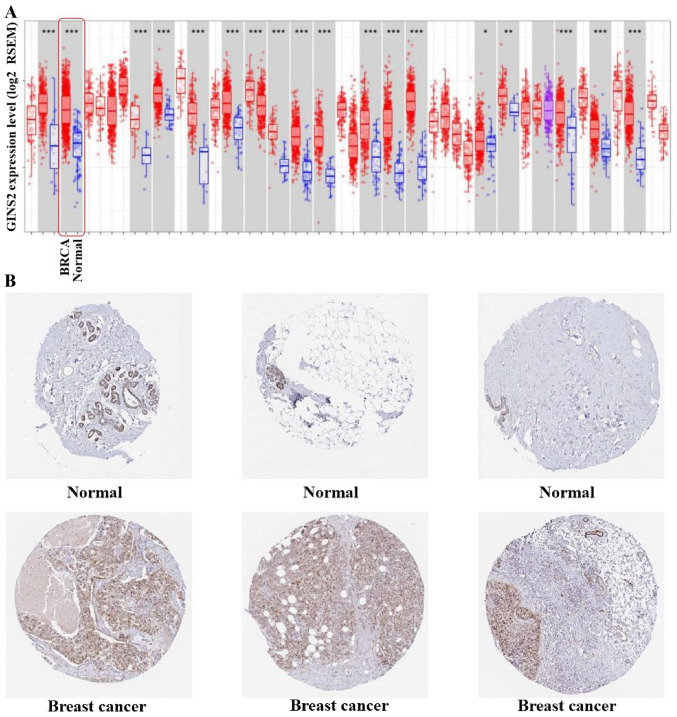
Figure 3.
GINS2 expression at the mRNA and protein levels. (A) GINS2 expression levels between breast tumor tissue and normal tissue in different types of tumors from The Cancer Genome Atlas database were determined using the Tumor Immune Estimation Resource database. *P<0.05; **P<0.01; ***P<0.001 vs. respective normal tissue. (B) GINS2 protein expression was determined using the Human Protein Atlas database. mRNA, messenger RNA.

