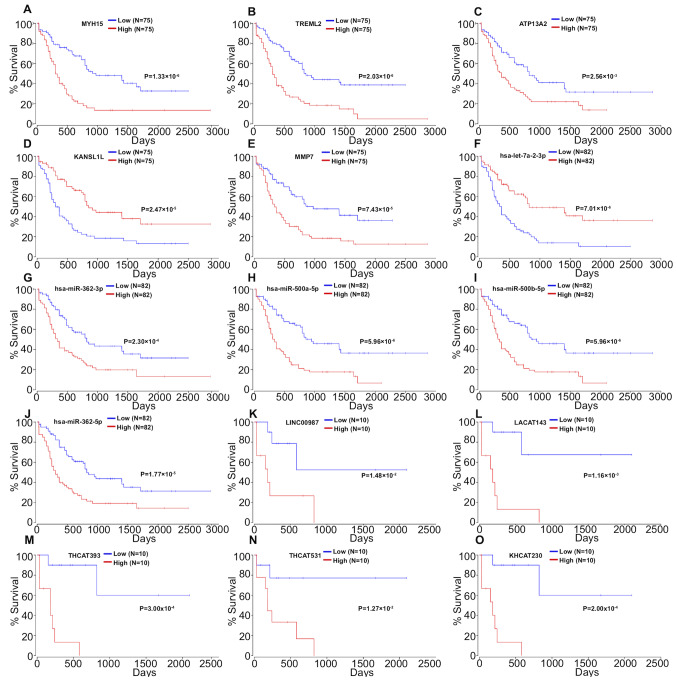
Figure 2.
Kaplan-Meier survival curves for (A) MYH15, (B) TREML2, (C) ATP13A2, (D) KANSL1L and (E) MMP7, (F) hsa-let-7a-2-3p, (G) hsa-miR-362-3p, (H) has-miR-500a-5p, (I) hsa-miR-500b-5p, (J) hsa-miR-362-5p, (K) LINC00987, (L) LACAT143, (M) THCAT393, (N) THCAT531 and (O) KHCAT230 associated with overall survival time of patients with acute myeloid leukemia.

