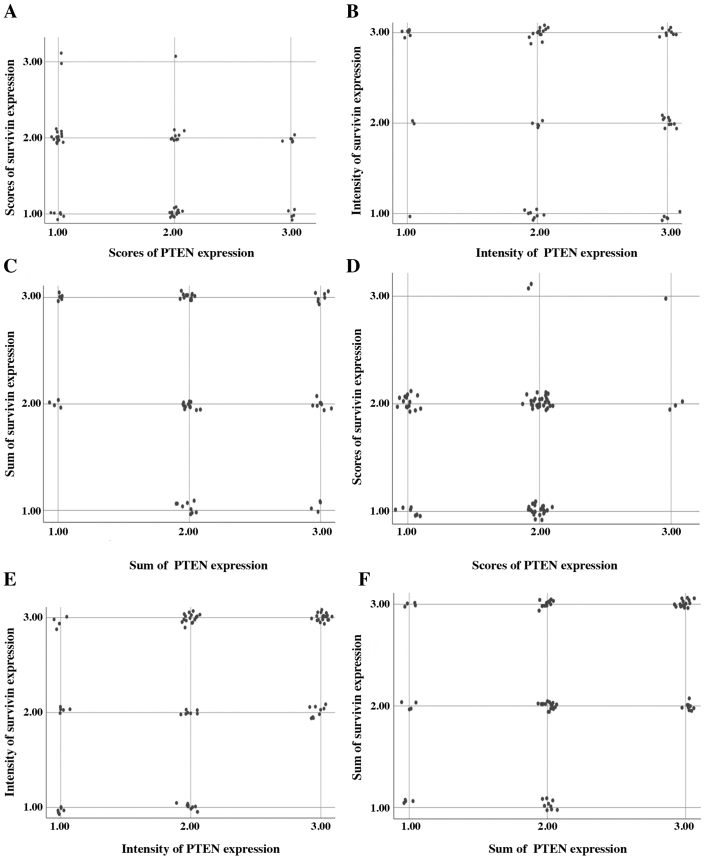
Figure 7.
Scatterplot revealing the association between positive survivin immunostaining and PTEN or p53 co-expression. Scatterplot of the association between (A) positive immunostaining scores for survivin and PTEN expression, (B) staining intensity for survivin and PTEN expression, (C) the sum of staining intensity and scores of survivin and PTEN-positive cells, (D) positive immunostaining scores for survivin and p53 expression, (E) staining intensity for survivin and p53 expression, (F) sum of staining intensity and scores of survivin and p53-positive cells. The scatterplots were created with jittering of the position of the data points to avoid overplotting. PTEN, phosphatase and tensin homolog.

