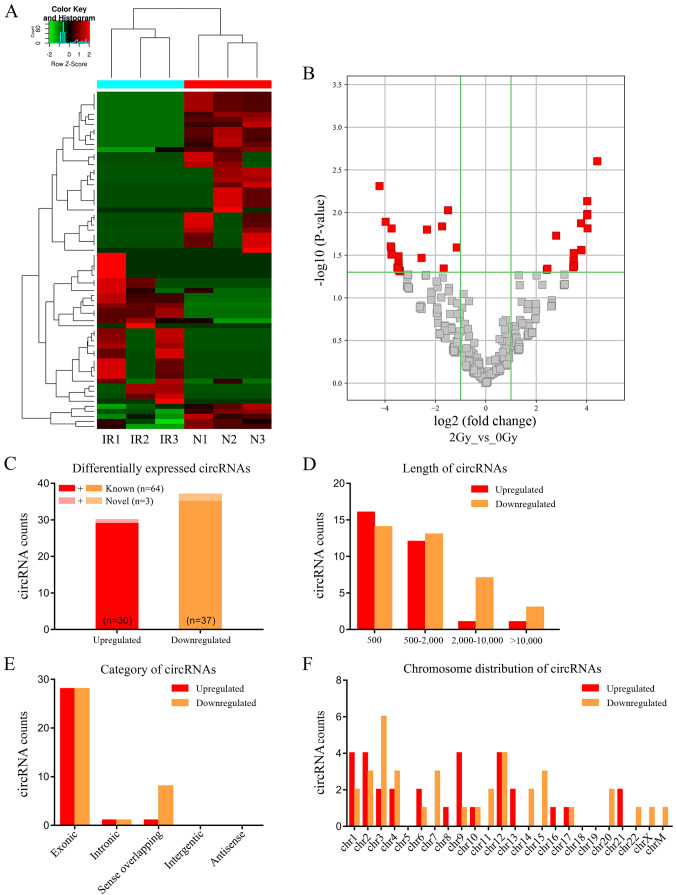
Figure 1.
Characteristics of differentially expressed circRNAs were detected by high-throughput sequencing of IR and N A549 cells. (A) Expression heatmap of distinguishable and clustered circRNAs in IR and N cells. (B) Volcano plots of differentially expressed circRNAs in IR and N cells. Vertical line indicates a 2.0-fold (log2 scale) change; the horizontal line represents the P-value of 0.05 (−log10 scale). Red dots indicate the differentially expressed circRNAs with statistical significance. (C) Counts of upregulated and downregulated circRNAs. In total, 67 circRNAs were significantly differentially expressed between IR and N A549 cells (fold change ≥2.0; P<0.05); of these, 30 circRNAs were significantly upregulated (red), 37 circRNAs were downregulated (yellow), and three circRNAs were novel (light red or light yellow). (D) Counts of differentially expressed circRNAs based on nucleotide length. (E) Counts of differentially expressed circRNAs based on five categories of circRNAs. (F) Counts of differentially expressed circRNAs based on chromosomal location. IR, irradiated; N, non-irradiated; circRNAs, circular RNAs; chr, chromosome.

