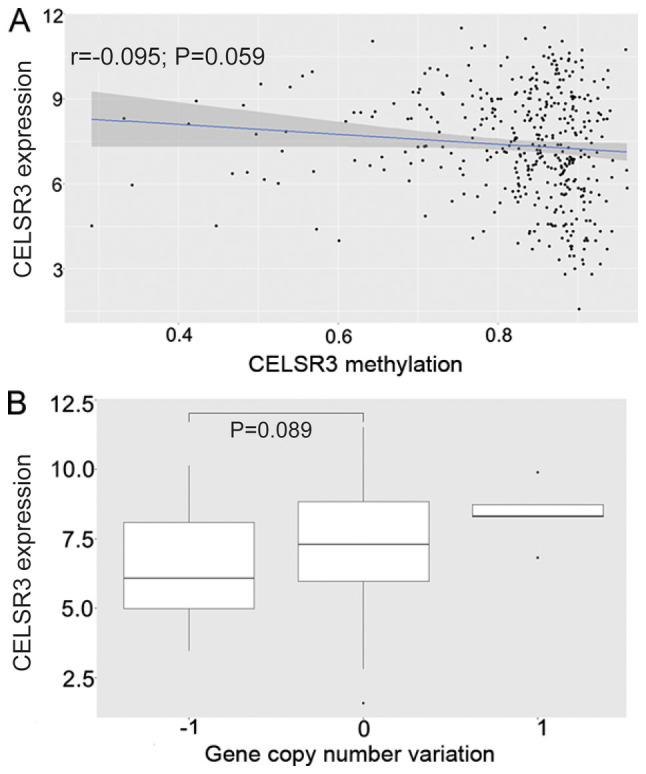
Figure 2.

Univariate analysis of CELSR3 expression, with its methylation and CNVs. (A) CELSR3 expression was negatively associated with its methylation (P=0.059). (B) CELSR3 expression did not decrease with copy number loss (P=0.089). CELSR3, cadherin EGF LAG seven-pass G-type receptor 3; CVN, copy number variation.
