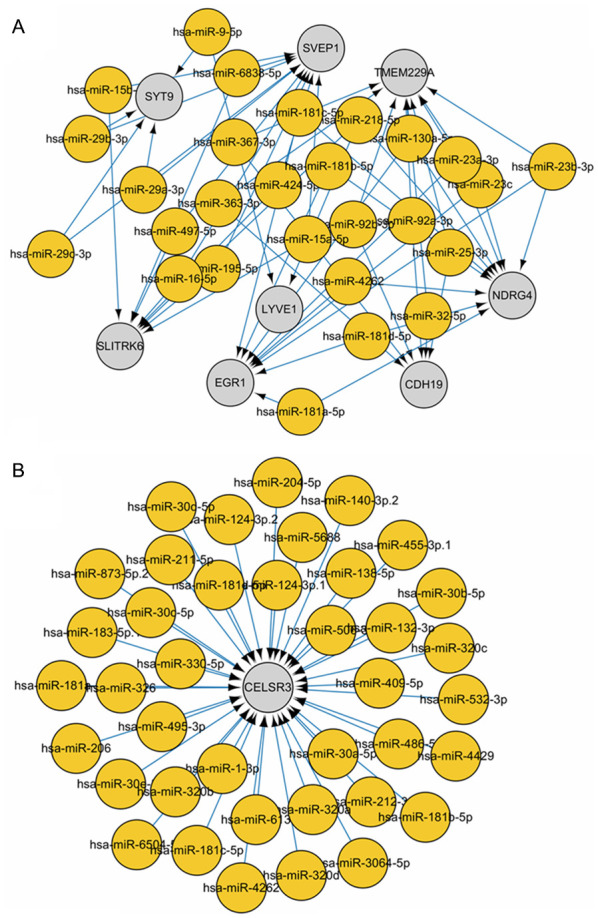
Figure 6.

Integrated miRNA-mRNA correlation network analysis. (A) Following elimination of CELSR3, its connected nodes and edges, and core DEGs and DEMs, a correlation network was identified based on the following filtering criteria: r<-0.3 and P<0.05. (B) DEM-DEG regulatory network diagram containing CELSR3 alone. miRNA, microRNA; CELSR3, cadherin EGF LAG seven-pass G-type receptor 3; DEGs, differentially expressed genes; DEMs, differentially expressed miRNAs.
