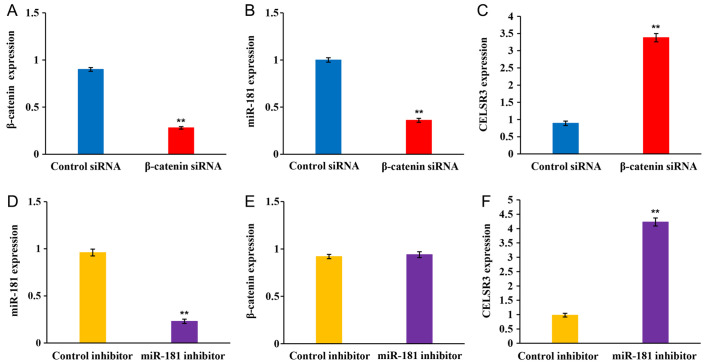
Figure 7.
Reverse transcription-quantitative PCR analysis. Expression levels of (A) β-catenin, (B) miR-181 and (C) CELSR3 in SK-Hep-1 cells transferred with β-catenin siRNA and control siRNA. Expression levels of (D) miR-181, (E) β-catenin and (F) CELSR3 in SK-Hep-1 cells transferred with the miR-181 inhibitor and control inhibitor. Error bars indicate mean ± standard deviation (n=3). The significance was assessed via one-way ANOVA (with Tukey's post hoc analysis). **P<0.01 vs. respective control. miR, microRNA; CELSR3, cadherin EGF LAG seven-pass G-type receptor 3; si, small interfering.

