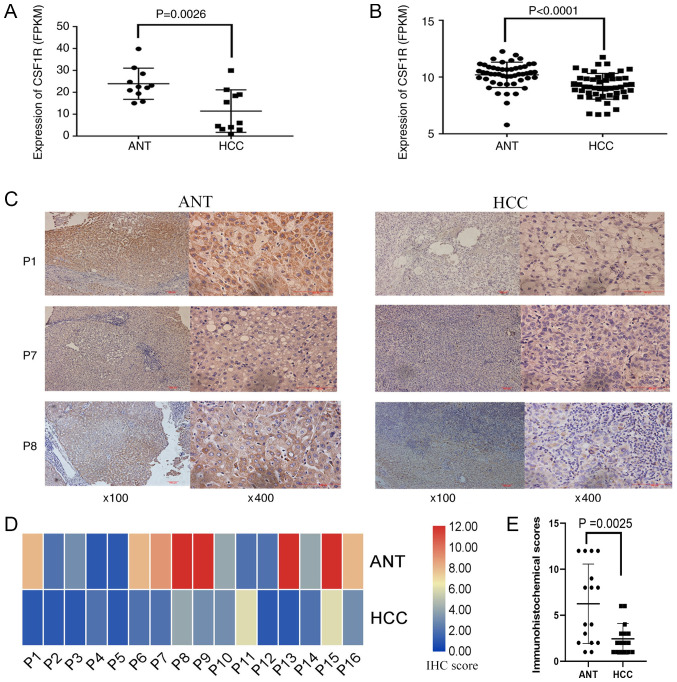
Figure 4.
CSF1R expression in ANTs and HCC tissues. (A) CSF1R expression in 11 pairs of ANTs and HCC tissues from patients with HCC (P=0.0026; paired t-test). (B) CSF1R expression in 50 pairs of ANTs and tumor tissues from patients with HCC. Information was obtained from TCGA (P<0.0001; paired t-test). (C) Tissue sections of 3 patients with HCC (P1, P7 and P8). IHC images were captured under a magnification, ×100 and ×400 using a light microscope. (D) Heatmap of the IHC results from 16 patients with HCC scored according to the 13-point method of the German IHC scoring system. Red indicated high expression and blue indicated low expression. Color depth indicated the level of expression. (E) Difference of CSF1R IHC score in ANTs and HCC tissues of 16 patients with HCC (P=0.0025; paired t-test). CSF1R, colony stimulating factor-1 receptor; ANT, adjacent non-cancerous tissue; HCC, hepatocellular carcinoma; FPKM, reads per kilobase of exon model per million mapped reads; TCGA, The Cancer Genome Atlas; P1/7/8, patient 1/7/8; IHC, immunohistochemical.

