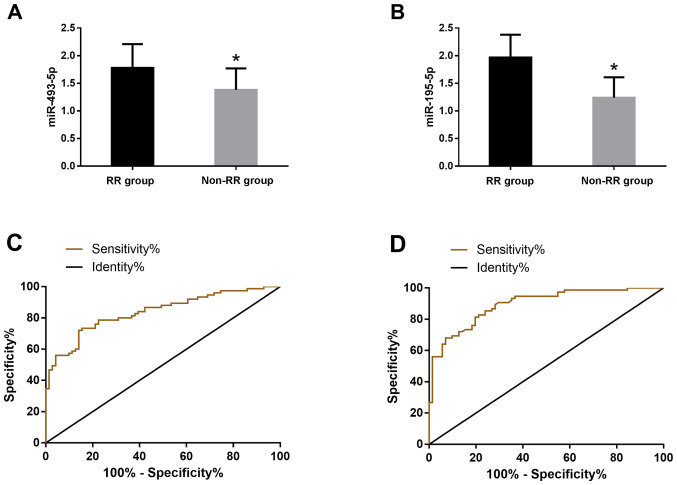
Figure 2.
Diagnostic value of miR-493-5p and miR-195-5p expression levels in patients with therapeutic effects. (A) The expression level of miR-493-5p in serum of RR group was significantly higher than that of non-RR group (P<0.05). (B) The expression level of miR-195-5p in serum of RR group was significantly higher than that of non-RR group (P<0.05). (C) ROC curve for the diagnosis of serum miR-493-5p in patients. (D) ROC curve for the diagnosis of serum miR-195-5p in patients. ROC, receiver operating characteristic; RR group, response rate group. *P<0.05, compared with RR group.

