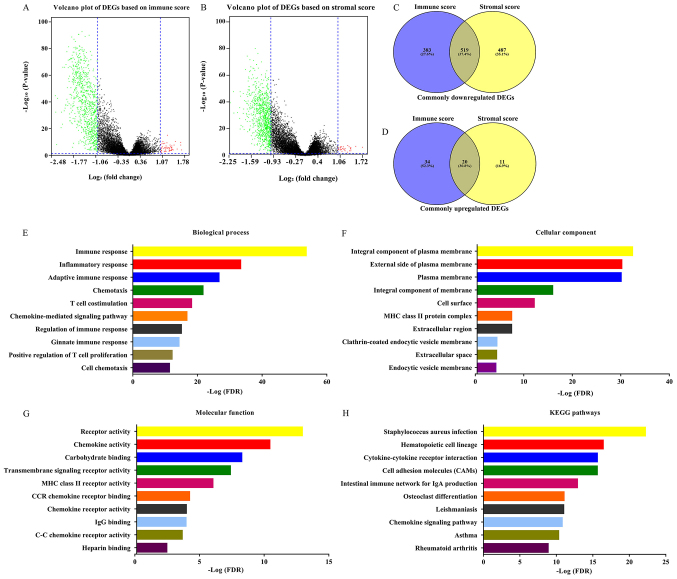
Figure 2.
Identification of DEGs in high and low immune and stromal score groups. (A) Volcano plot of DEGs based on immune scores of low score group vs. high score group. (B) Volcano plot of DEGs based on stromal scores of low score group vs. high score group. Venn diagram analysis of (C) common downregulated DEGs and (D) common upregulated DEGs. Top ten (E) Biological process, (F) Cellular component and (G) Molecular function, Gene Ontology terms of common downregulated DEGs. (H) Top ten KEGG pathways of common downregulated DEGs. DEGs, differentially expressed genes; KEGG, Kyoto Encyclopedia of Genes and Genomes; FDR, false discovery rate.

