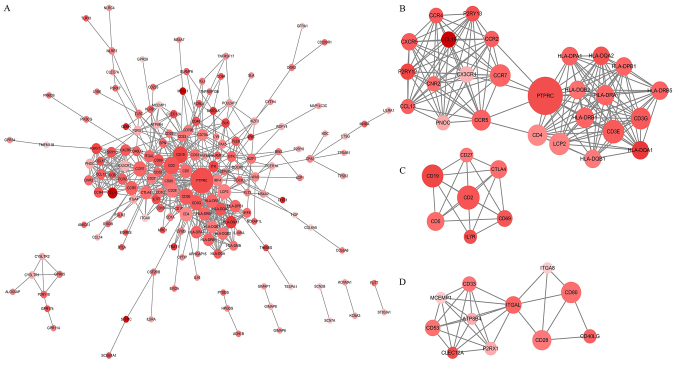
Figure 4.
PPI network construction of 281 downregulated DEGs of prognostic value. (A) PPI network of the 281 downregulated DEGs constructed with Cytoscape software. (B-D) Top three modules of the PPI network. The color of a node in the PPI network reflects the log fold change value based on immune scores, and the size of the node indicates the number of proteins interacting with the designated protein based on immune scores. PPI, protein-protein interaction.

