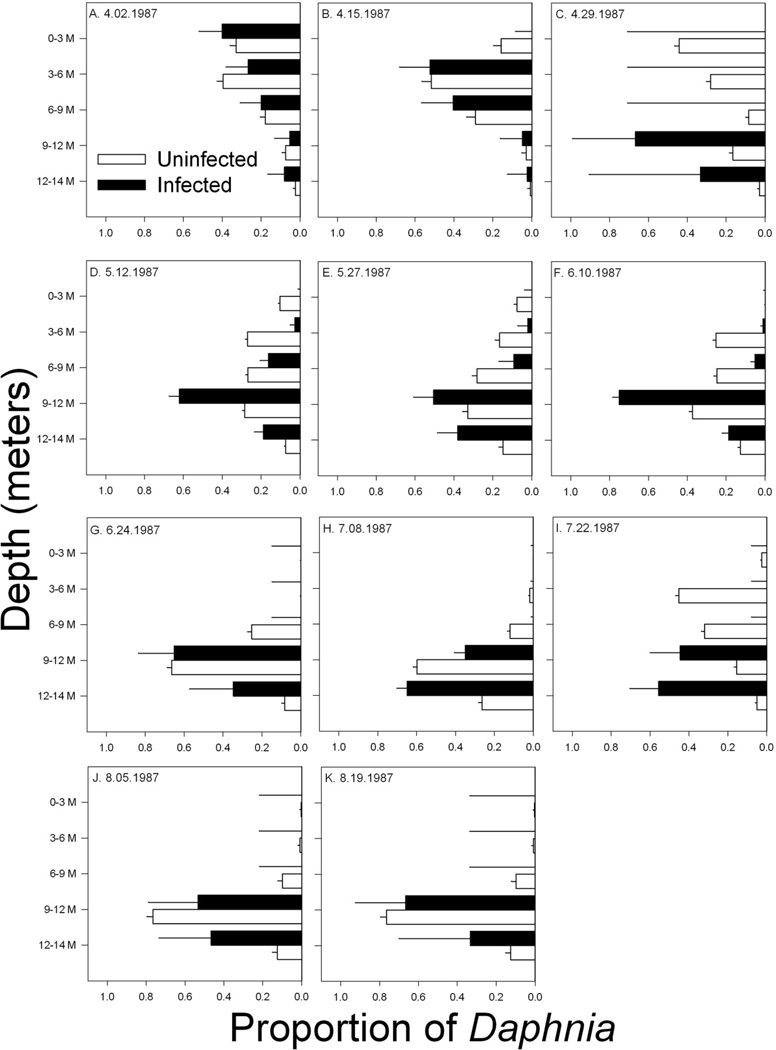
Figure 3.

Vertical distribution of infected and uninfected D. pulicaria in Devil’s Lake. For each sampling date, values represent the proportion of infected and uninfected hosts found in each depth (i.e., of the total number of (un)infected hosts collected on a given date, the fraction that occurred at a particular depth). Samples were collected only during the daytime. Error bars are the 95% upper confidence interval for a proportion. No infection was detected in samples processed after August.
