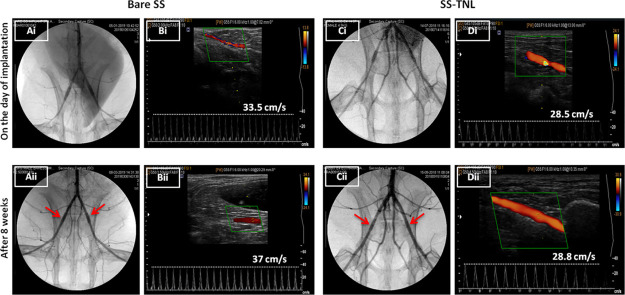
Figure 4.
Angiogram and ultrasound images of bare [A(i),B(i)] and SS TNL [C(i),D(i)] stents on the day of implantation and after 8 weeks prior to euthanasia [A(ii),B(ii) for bare; C(ii),D(ii) for SS TNL]. Arrows in the angiogram point to the stented site in the artery. The value for the blood flow velocity of the respective animal is depicted in the ultrasound panel.

