. 2020 Jul 23;128(7):077007. doi: 10.1289/EHP6664

Figure 3.

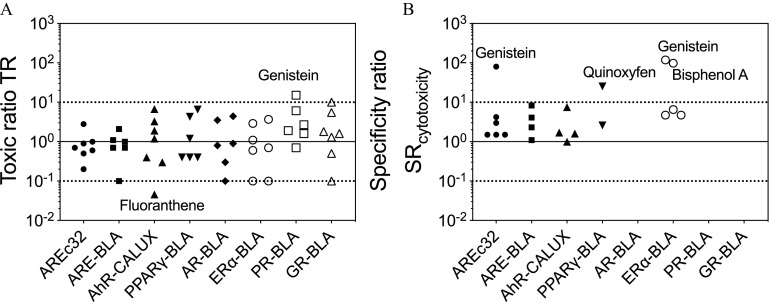
Figure 3 is a set of two graphs. Figure 3A is a graph, plotting toxic ratio T R, ranging from 10 superscript negative 2 to 10 superscript 3 in unit increments (y-axis) across A R E c 32, A R E-B L A, A h R-C A L U X, P P A R gamma-B L A, A R-B L A, E R alpha-B L A, P R-B L A, and G R-B L A (x-axis) for Genistein and Fluoranthene. Figure 3B is a graph, plotting specificity ratio S R subscript cytotoxicity, ranging from 10 superscript negative 2 to 10 superscript 3 in unit increments (y-axis) across A R E c 32, A R E-B L A, A h R-C A L U X, P P A R gamma-B L A, A R-B L A, E R alpha-B L A, P R-B L A, and G R-B L A (x-axis) for Genistein, Quinoxyfen, and Bisphenol A.

(A) Toxic ratios and (B) specificity ratios of the environmental chemicals (Bisphenol A, Quinoxyfen, Fluoranthene, Genistein, Coumarin, 8-Gingerol, Zingerone) in all reporter gene assays. Underlying data are in Tables S10–S17. The solid line is a SRcytotoxicity of 1, and the dashed lines are the thresholds of 10 and 0.1. If the effects did not exceed 10%, then no IC10 and/or EC10 could be derived, and there is no symbol in the figure. Underlying data are in Tables S2–S9.