. 2020 Jul 23;128(7):077008. doi: 10.1289/EHP7030

Figure 5.

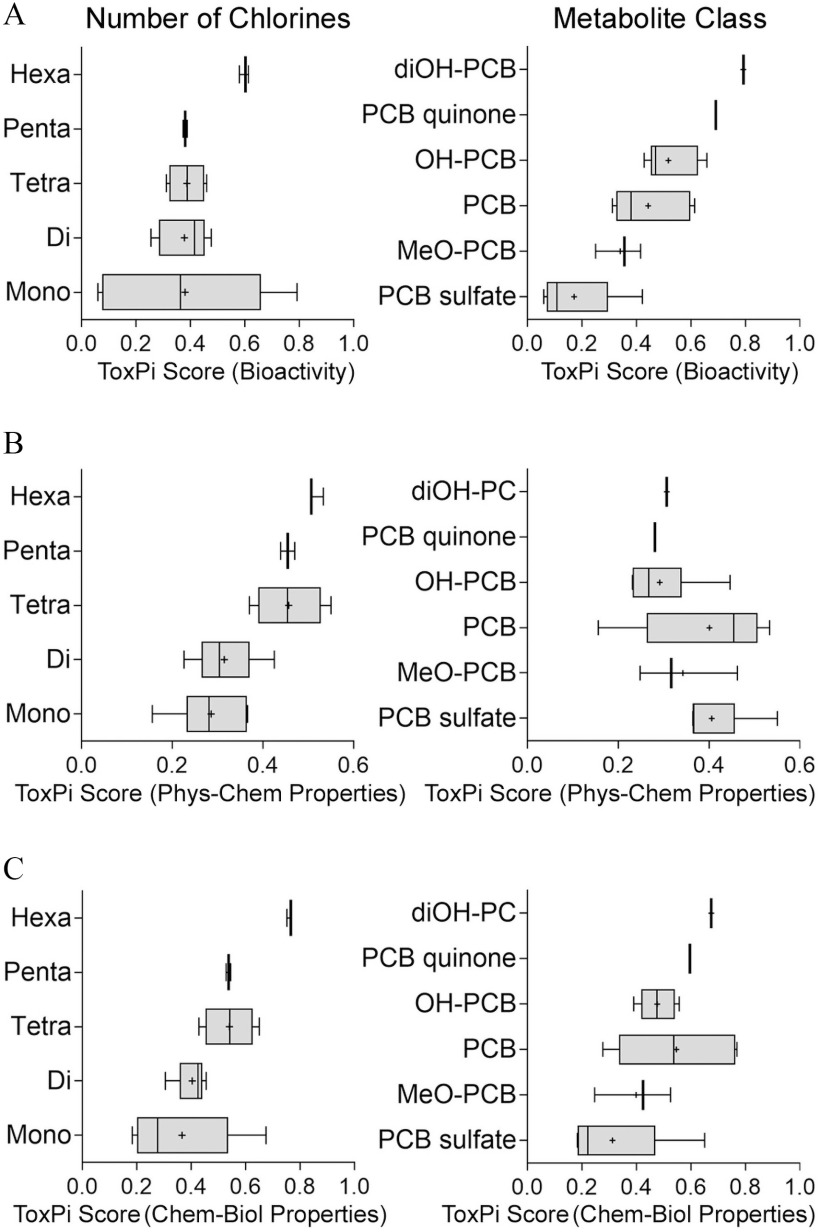
Figure 5A is a set of two graphs. First graph titled number of chlorines plots Hexa, Penta, Tetra, Di, and Mono (y-axis) across ToxPi score (Bioactivity), ranging from 0.0 to 1.0 in increments of 0.2 (x-axis). Second graph titled metabolite class plots d i O H-P C B, P C B quinone, O H-P C B, P C B, M e O-P C B, and P C B sulfate (y-axis) across ToxPi score (bioactivity), ranging from 0.0 to 1.0 in increments 0.2 (x-axis). Figure 5B is a set of two graphs. First graph plots Hexa, Penta, Tetra, Di, and Mono (y-axis) across ToxPi score (Phys-Chem Properties), ranging from 0.0 to 0.6 in increments of 0.2 (x-axis). Second graph plots d i O H-P C B, P C B quinone, O H-P C B, P C B, M e O-P C B, and P C B sulfate (y-axis) across ToxPi score (Phys-Chem Properties) from 0.0 to 0.6 in increments of 0.2 (x-axis). Figure 5C is a set of two graphs. First graph plots Hexa, Penta, Tetra, Di, and Mono (y-axis) across ToxPi score (Chem-biol properties), ranging 0.0 to 1.0 in increments 0.2 (x-axis). Second graph plots d i O H-P C B, P C B quinone, O H-P C B, P C B, M e O-P C B, and P C B sulfate (y-axis) across ToxPi score (Chem-biol properties), ranging 0.0 to 1.0 in increments 0.2 (x-axis).

Ranking of the PCBs and their metabolites chemical classes using (A) in vitro testing data, (B) physicochemical descriptors, or (C) combination of the two. Groupings based on the number of chlorine atoms (left panels) or metabolite class (right panel) are shown. ToxPi scores from the analysis shown in Figure 4 were used to generate box-and-whisker plots for each group. Individual box-and-whisker plots indicate the median (line), mean (cross), interquartile range (box), and min–max span (whiskers). Chemical names and abbreviations of PCBs and metabolites are listed in Table S1. Note: PCB, polychlorinated biphenyls; ToxPi, Toxicological Prioritization Index.