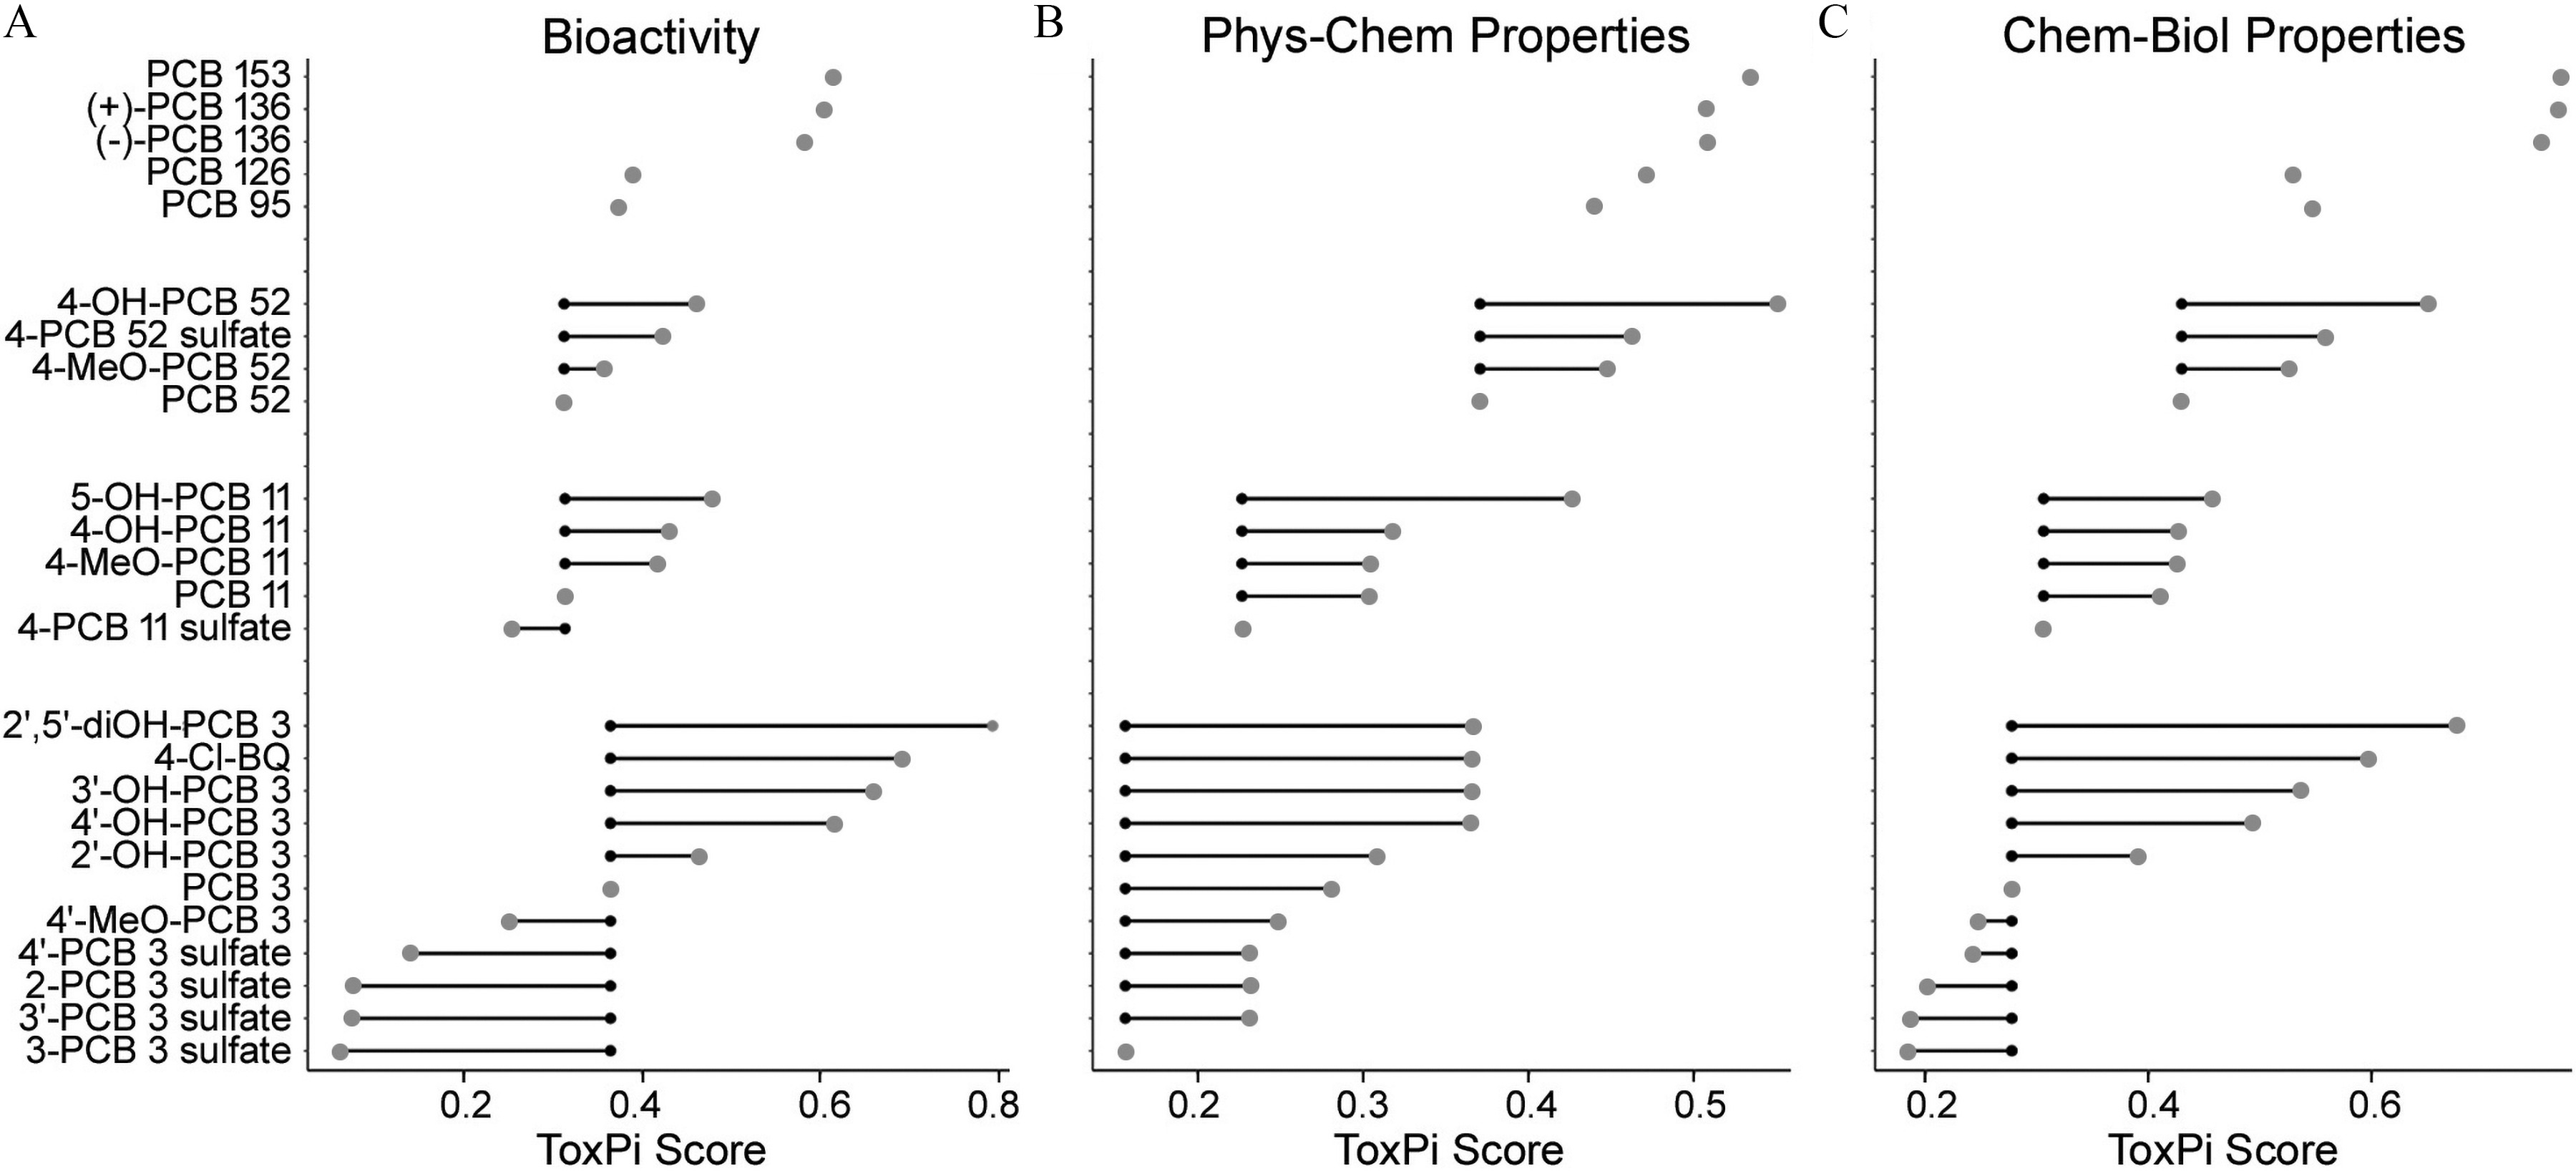
Figure 6.

Relative change in the in vitro potency of the parent PCBs, depending on (A) their metabolism, and (B) integrated congener- and metabolite-specific distributions of calculated physicochemical characteristics, and (C) integrated chemical-biological profiles. ToxPi scores for each compound are plotted based on the analysis in Figure 4. Chemical names and abbreviations of PCBs and metabolites are listed in Table S1. Small black dots are ToxPi scores for the respective parent PCB congener; large gray dots are ToxPi scores for PCB metabolites; connecting lines indicate PCB parent–metabolite relationship. Data on ToxPi scores are provided in the Supplemental Excel file, tab ToxPi Scores. Note: PCBs, polychlorinated biphenyls; ToxPi, Toxicological Prioritization Index.
