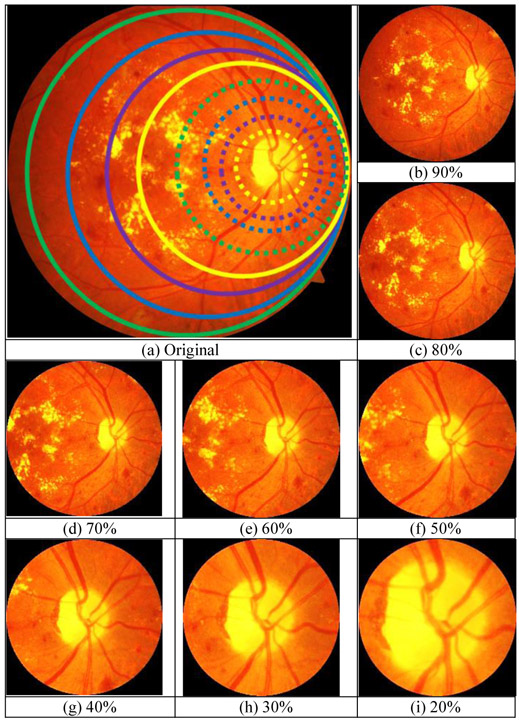
Fig. 5.
(a) Comparison of the FoV of synthetic images with different percentages w.r.t the original image where the solid green, blue, purple, and yellow lines represent 90%, 80%, %70, and %60 FoV, respectively. The dotted green, blue, purple, and yellow lines represent 50%, 40%, 30%, and 20% FoV, respectively. The corresponding synthetic images for (b) 90%, (c) 80%, (d) 70%, (e) 60%, (f) 50%, (g) 40%, (h) 30%, (i) 20%.

