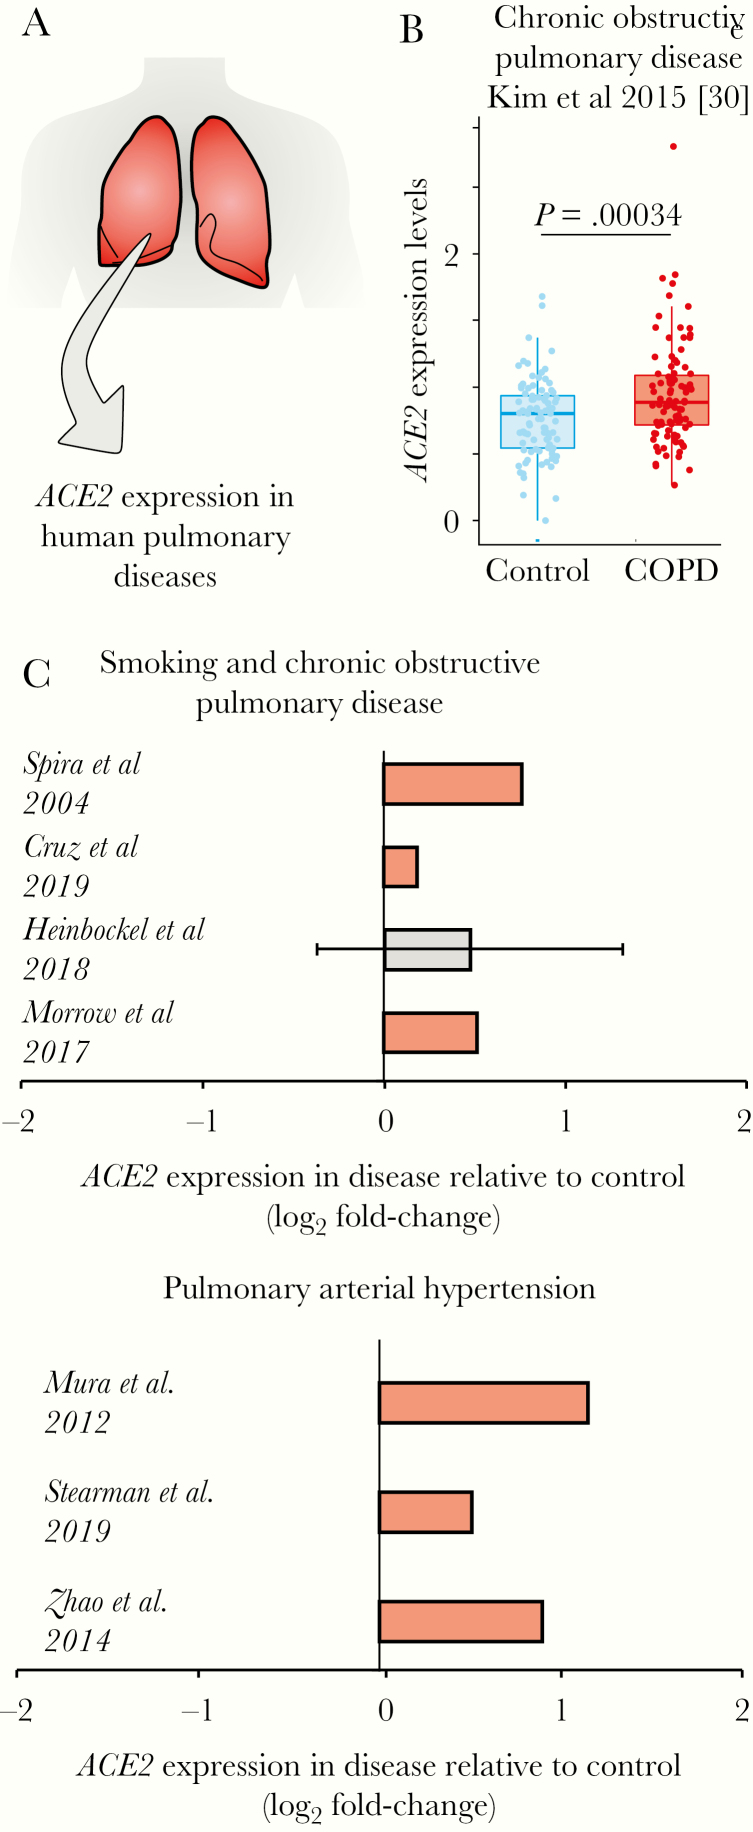
Figure 3.
ACE2 is upregulated in patients with lung diseases. A, Analysis of ACE2 expression in lung transcriptome datasets of patients with human pulmonary diseases. B, ACE2 expression in patients with chronic obstructive pulmonary disease (COPD). The boxplot on the right shows the difference between COPD patients (red dots) and control individuals (blue dots). Student t test P value is given. C, ACE2 is upregulated in patients with COVID-19 comorbidities. Each bar represents the log2 expression fold-change between patients and control individuals. The error bars indicate the 95% confidence interval. Bars in red represent a P value <.05 and in grey a nonsignificant P value. The original studies are indicated and can be found in Supplementary Table 1.

