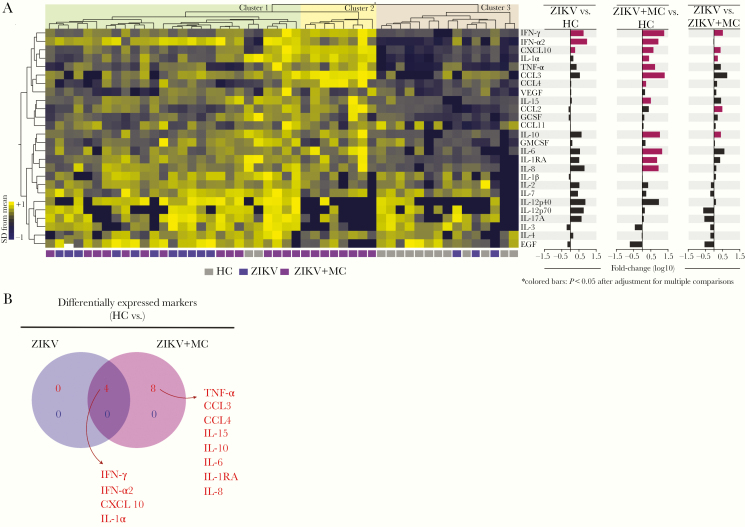
Figure 1.
Inflammatory imbalance in Zika virus (ZIKV) infection. Concentrations of several markers of inflammation were assessed in plasma samples from a cohort of 50 children. Data were log10-transformed. (A) Hierarchical cluster analysis using z-scored values of each parameter (Ward’s method) was used to depict the overall biomarker expression profile in the study. Fold differences were calculated, and statistically significant differences are highlighted in colored bars. (B) Venn diagram describes the markers that values were statistically different between ZIKV vs ZIKV + MC. HC, healthy control; MC, microcephaly.

