
Fig. 2. Wildlings resemble wild mice and differ significantly from conventional laboratory mice in the composition and size of the gut mycobiome and virome.
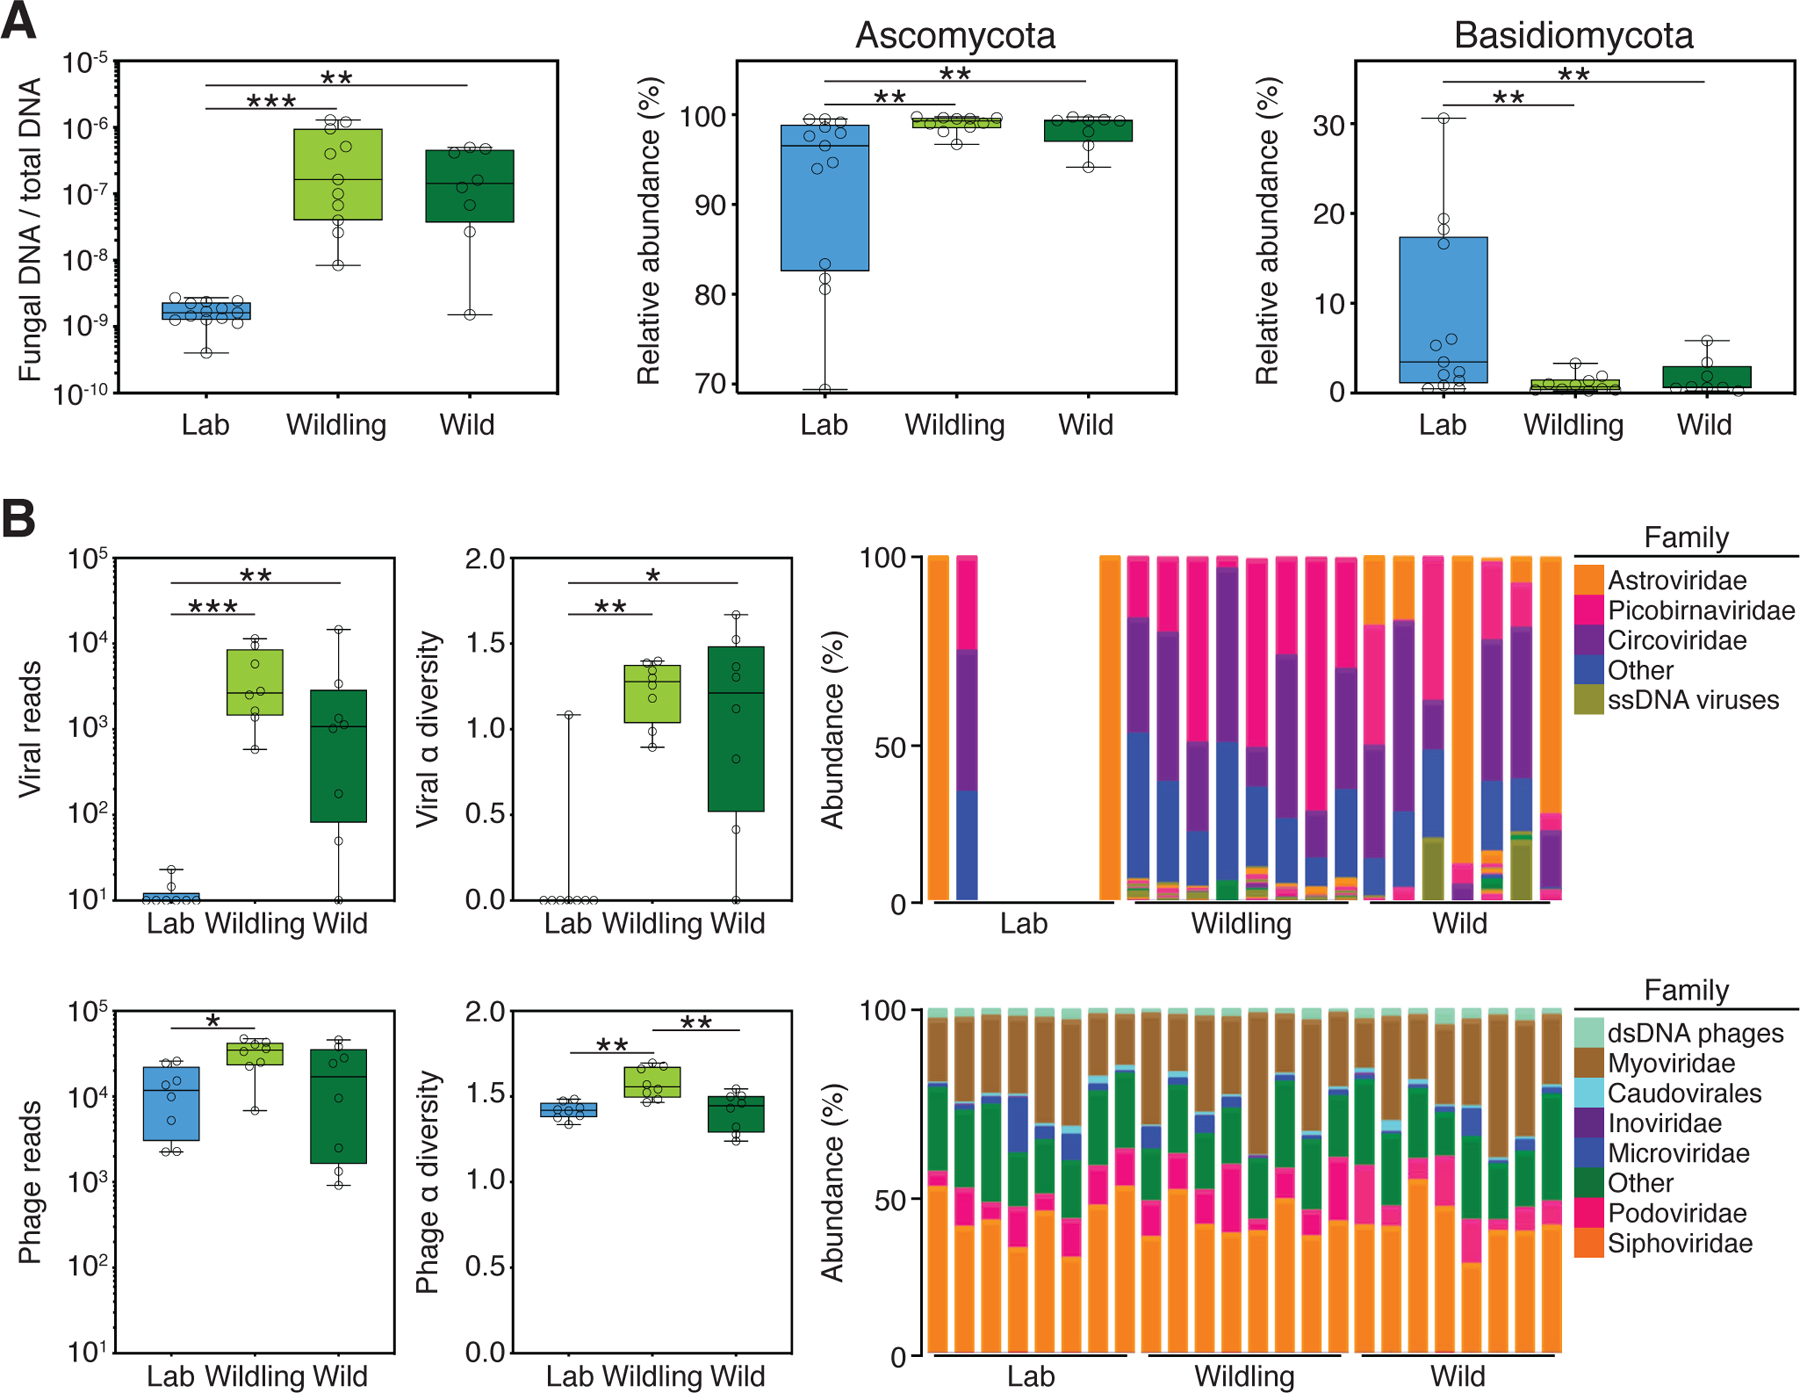
ITS1–2 rDNA profiling and next generation virome sequencing data comparing the gut microbiome of wildlings, wild mice (Wild), and conventional laboratory mice (Lab). (A) Relative abundance of fungi by qPCR (18S) and ITS1–2 rDNA next generation sequencing; fungal DNA relative to total DNA (left); relative abundance at the rank of phylum by next generation sequencing (center and right). (B) Next-generation sequencing data for viruses and phages. Left panel: Total amount of reads. Center panel: Shannon α diversity index. Right panel: Relative abundance at the rank of family. Data shown are from 8–13 independent biological replicates per group. Box plots show median, IQR (box), and minimum to maximum (whiskers). *P < 0.05, **P < 0.01, ***P < 0.001; as determined by parametric one-way ANOVA with Tukey multiple comparison with 95% confidence interval (Gaussian model), or non-parametric Kruskal–Wallis H test with Dunn’s multiple comparison.