
Fig. 4. The microbial genome shapes the immune landscape of blood.
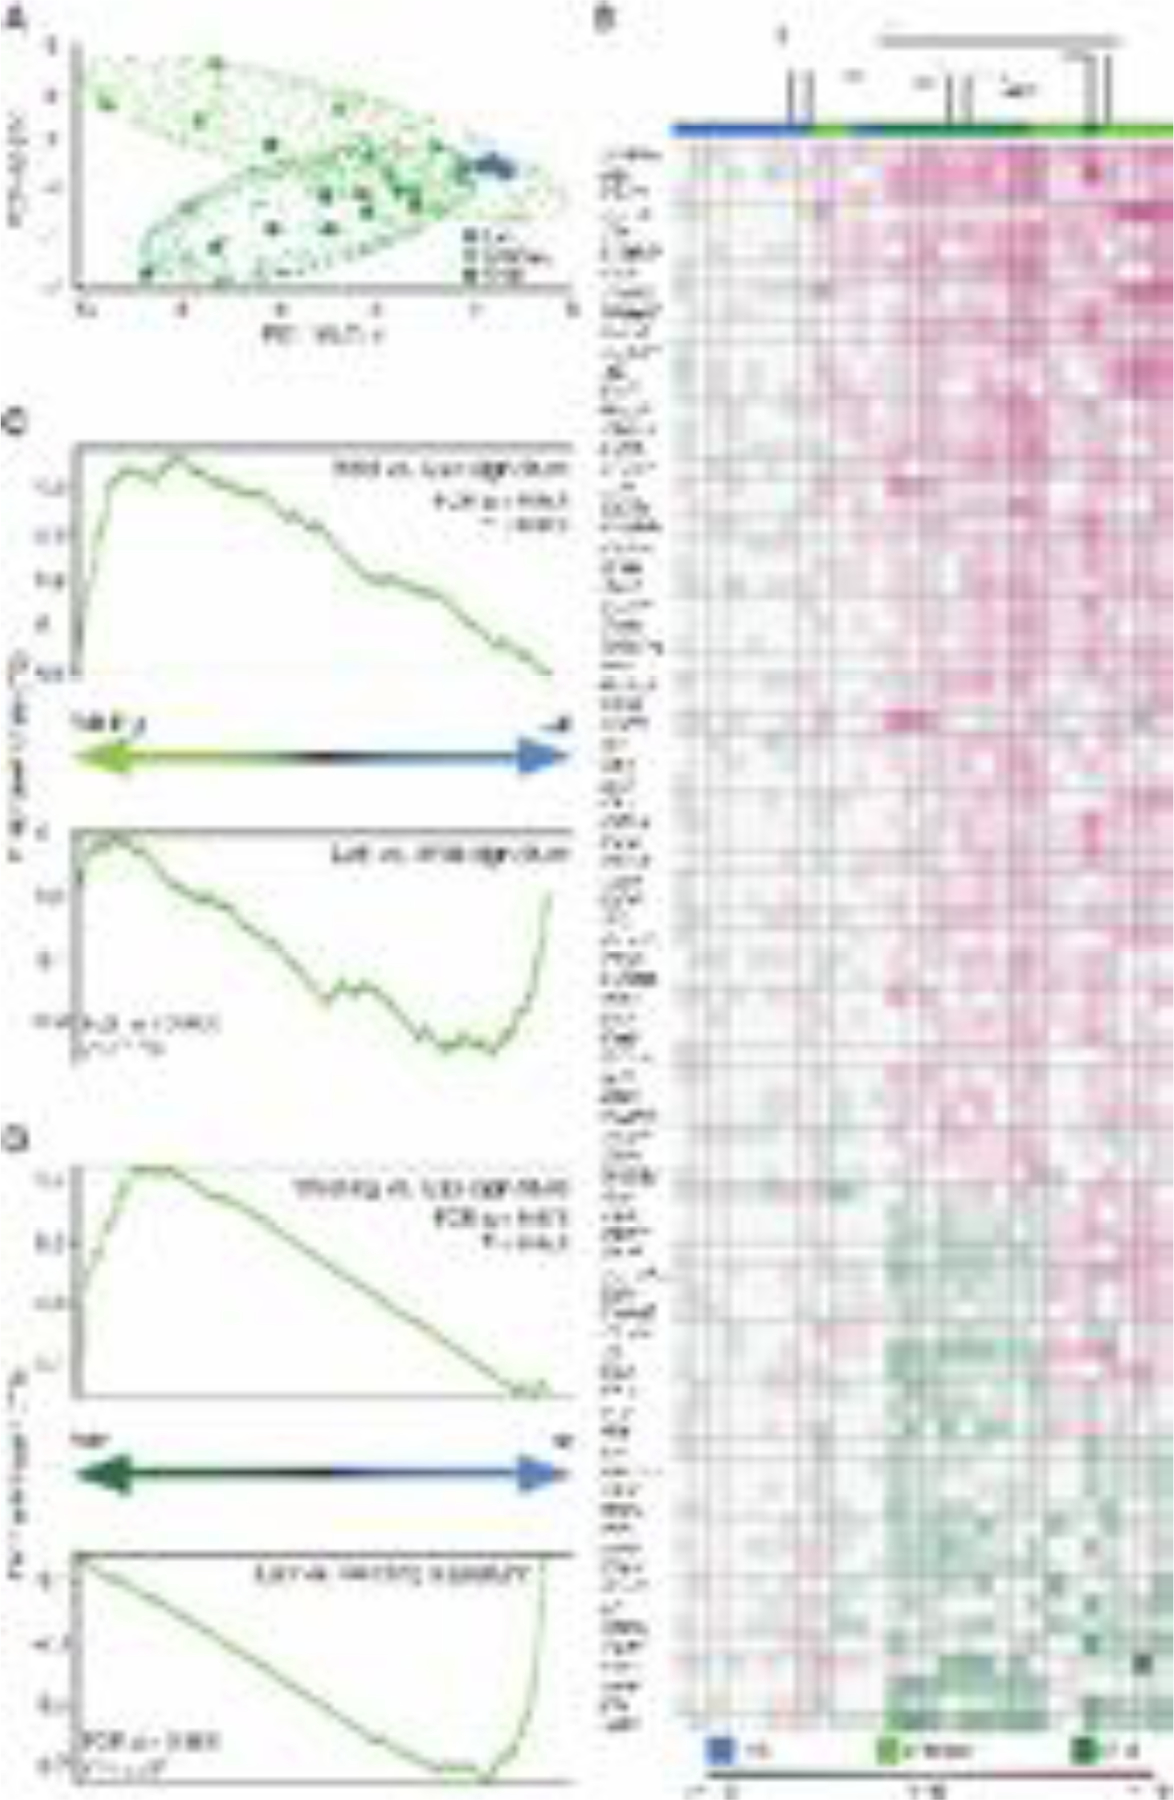
RNA sequencing data comparing the transcriptional profile of wildlings, wild mice (Wild), and conventional laboratory mice (Lab). (A) Principal component analysis of reads per kilobase million (RPKM) values of significantly deregulated immune-related genes in blood mononuclear cells. (B) Unsupervised clustering (Kendal) of immune-related genes that are differentially expressed in Wild versus Lab (log2–fold change values). (C, D) Gene set enrichment analysis (GSEA) of all genes with RPKM > 5. (C) Gene sets ranked by differential expression in wildling versus Lab; Wild vs. Lab and Lab vs. Wild signature (top 100 gene sets). (D) Gene sets ranked by differential expression in Wild versus Lab; Wildling vs. Lab and Lab vs. Wildling signature (top 100 gene sets). Data shown are from 9–10 independent biological replicates per group.