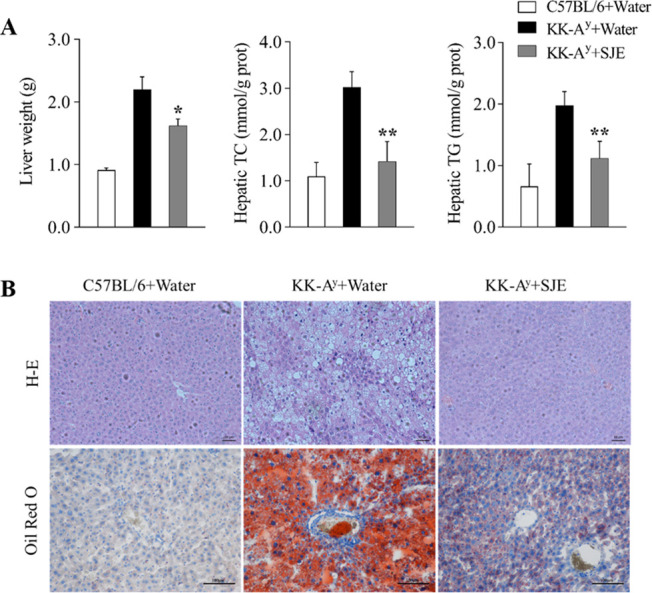
Figure 4.

(A) Liver weight, hepatic cholesterol (TC) level, and hepatic triglyceride level (TG) in diabetic KK-Ay mice (n = 5); (B) Hematoxylin and eosin staining and Oil Red O staining of transverse liver section (200× magnification) (n = 5). Values are expressed as mean ± SE. *p < 0.05 and **p < 0.01; the KK-Ay + SJE group compared to the KK-Ay + water group.
