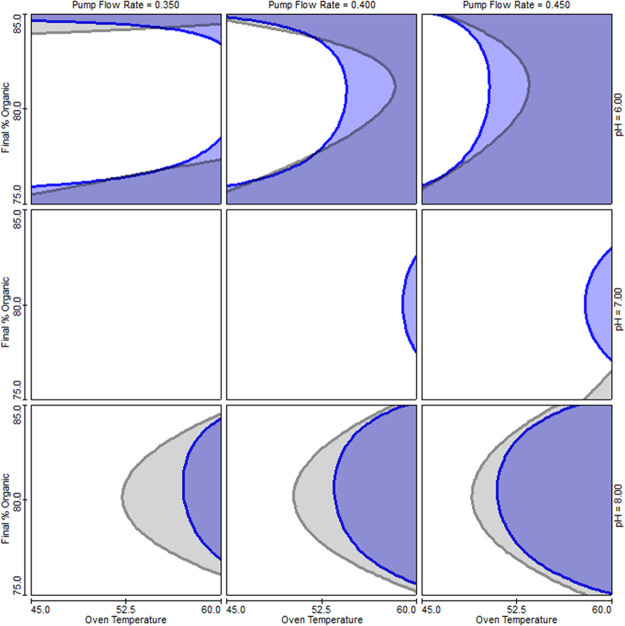
Figure 12.
Trellis graphs from DoE to establish CMA models and robustness testing. Graph representing an area where the defined criteria are met in white color—design space. The colors are areas where the criteria are not met: blue = Rc1 ≤ 1.5, gray = Cpk ≤ 1.33. x = column temperature (45–60 °C); y = final percent of mobile phase B in the first gradient (75–85%); at pH of 6.0 (top line), 7.0 (middle line) and 8.0 (bottom line); and pump flow of 0.35 (left column), 0.40 (middle column), and 0.45 mL/min (right column).

