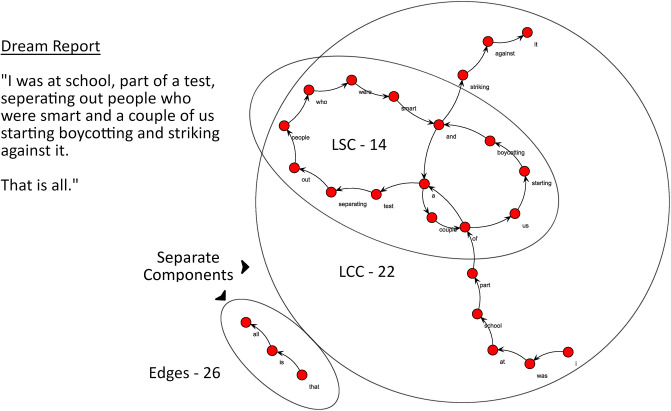
Fig 1. Word graph analysis applied to dream reports.
Dream report represented as a directed word graph. Nodes indicated in red, edges indicated as black arrows. There are two components in this graph: one with three nodes and the other with 22 nodes. LCC and LSC measures are derived from the larger component.

