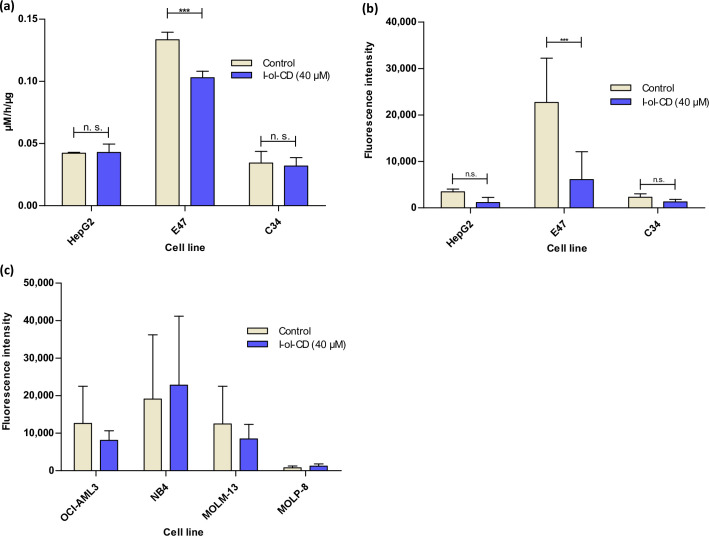
Fig 2. Cell culture effects of I-ol.
Three hepatocyte cell lines (HepG2 cells, E47 cells and C34 cells) as well as three AML cell lines (OCI-AML3, NB4 and MOLM-13) and one myeloma cell line (MOLP-8) were incubated with 40 μM I-ol complexed with HPβCD (I-ol-CD) 72 h prior to the experiment. n = 3 independent experiments (a) Specific enzyme activity of CYP2E1 in hepatocytes. (b) ROS production in Hepatocytes. (c) ROS production in AML and myeloma cell lines. These cell lines served as negative control. Results are shown as means ± SDs. Statistical evaluation was carried out by two-way ANOVA followed by a Bonferroni post-hoc test. * p < 0.05 (significant); ** p < 0.01 (very significant); *** p < 0.001 (extremely significant).

