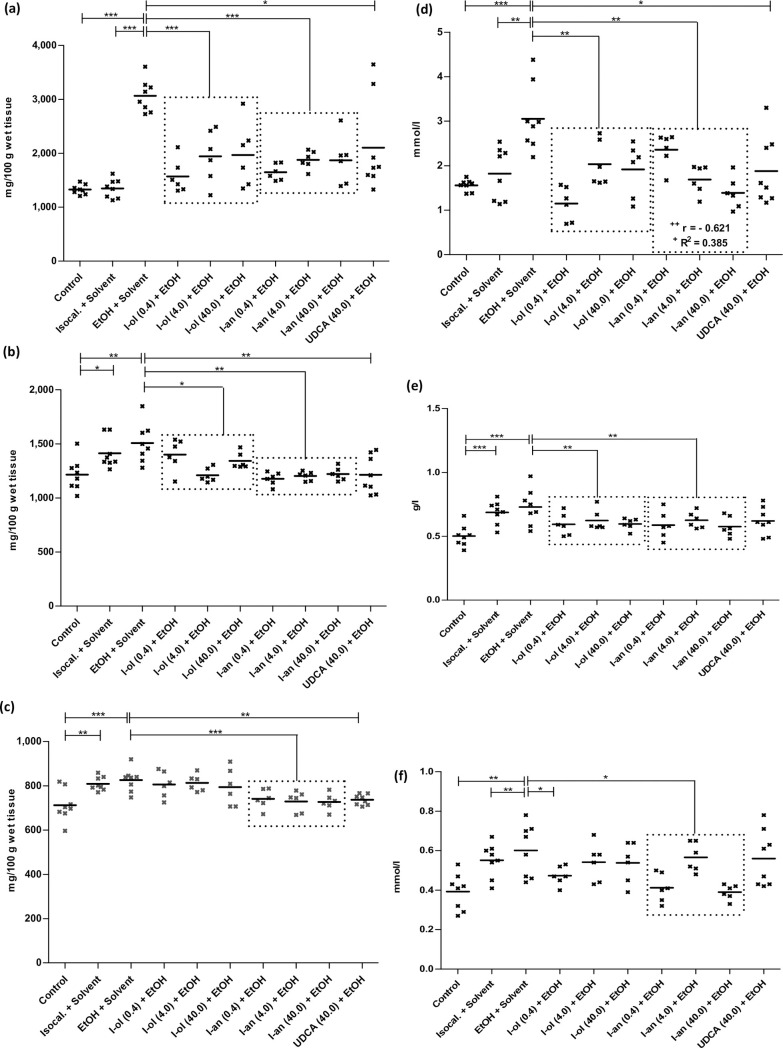
Fig 4. Liver and serum fat content.
(a) The triglycerides of the liver are elevated by 131% and 127% compared to control groups 1 and 2. Compared to the disease group, I-ol and I-an cause an average decrease by 40% and 41% respectively. UDCA displays a decrease by 31%. (b) Liver phospholipids are elevated by 24% compared to control group 1 but no statistically significant changes are observed compared to control group 2. Compared to the disease group, I-ol and I-an cause an average decrease of 13% and 20% respectively. UDCA displays a decrease by 20%. (c) The liver cholesterol level is increased by 16% compared to control group 1. Compared to the disease group, I-an and UDCA cause a decrease of 11%. I-ol has no influence on this parameter. (d) The serum triglycerides are elevated by 96% and 68% compared to control groups 1 and 2. Compared to the disease group, I-ol and I-an show an average decrease of 44% and 41% respectively. UDCA has a 39% reduction. (e) Serum VLDL is increased by 45% compared to control group 1. In comparison to the disease group, I-ol and I-an show an average decrease by 17% and 18% respectively. (f) The LDL cholesterol level in serum is elevated by 53% and 9% compared to control groups 1 and 2. Compared to the disease group, I-an shows an average decrease of 24%. Animals were treated in groups and statistical data evaluation was done as described in Fig 3.

