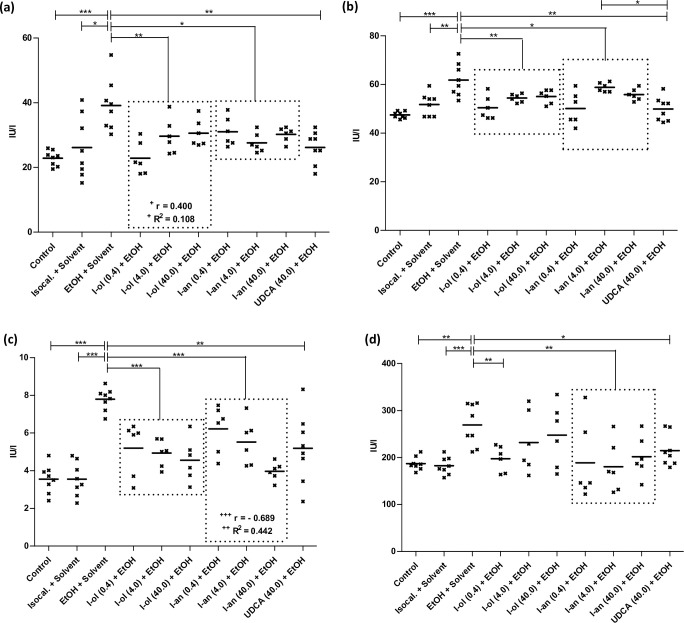
Fig 5. Enzymatic activity of liver enzymes.
(a) ALT is elevated by 71% and 50% compared to control groups 1 and 2. Compared to the disease group, I-ol and I-an show an average decrease in enzymatic activity by 29% and 24%, respectively. UDCA shows a decrease by 33%. (b) AST is elevated by 30% and 19% respectively compared to control groups 1 and 2. Compared to the disease group, I-ol and I-an show an average decrease in enzymatic activity of 14% and 11% respectively. UDCA displays a decrease of 19%. (c) γ-GT is elevated by 119% over control groups 1 and 2, with I-ol and I-an showing an average decrease in enzymatic activity of 37% and 33% respectively over the disease group. UDCA displays a decrease of 33%. (d) AP is elevated by 44% and 48% respectively compared to control groups 1 and 2. Compared to the disease group, I-an shows an average decrease in enzymatic activity of 29%. I-ol is able to reduce the activity in its lowest concentration by 27%. UDCA shows a decrease by 20%. Animals were treated in groups and statistical data evaluation was done as described in Fig 3.

