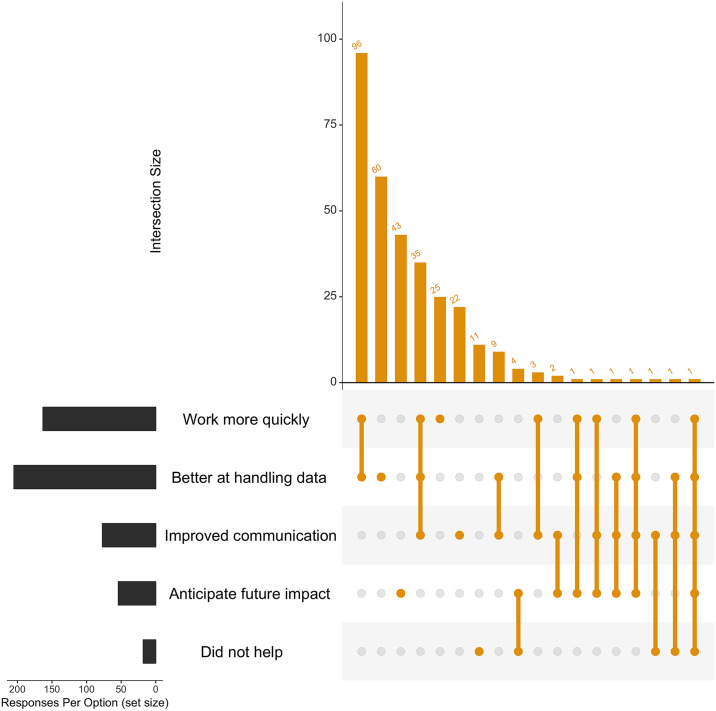
Fig 3. How did the training help with your work?.
Each respondent was able to select multiple answers to this question. The ‘upset diagram’ illustrates how participants felt that the training has helped them with their work (‘Response Per Option (set size)’, lower LHS) as well as the different combinations of answers selected by the same individual, represented by the size of the intersection (‘Intersection Size’, RHS, ‘orange’). Packages used to create this graph (and graph in Fig 4) in the R environment were tidyverse [12] and UpsetR [13]. LHS, left-hand side; RHS, right-hand side.

