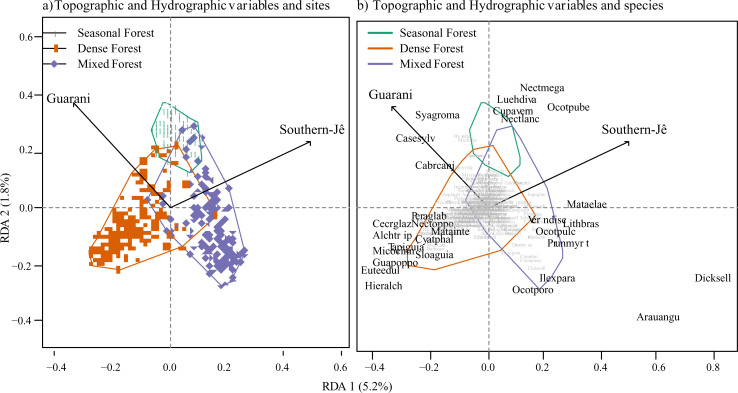
Fig 6. The redundancy analysis of species abundance and the probability of occurrence of Southern-Jê and Guarani archaeological sites.
Arrows represent maximum variation directions. a) Dots represent vegetation sampling units. b) Shows the species distribution. Polygons and colors indicate forest typologies in both figures.

