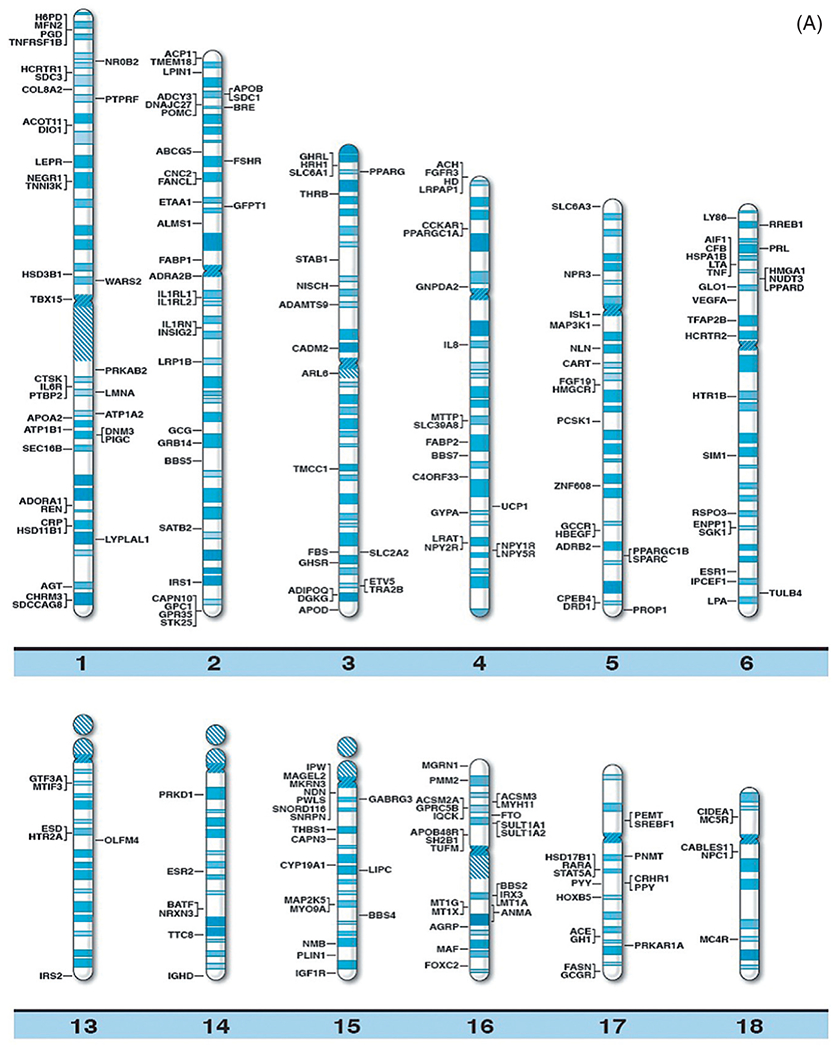
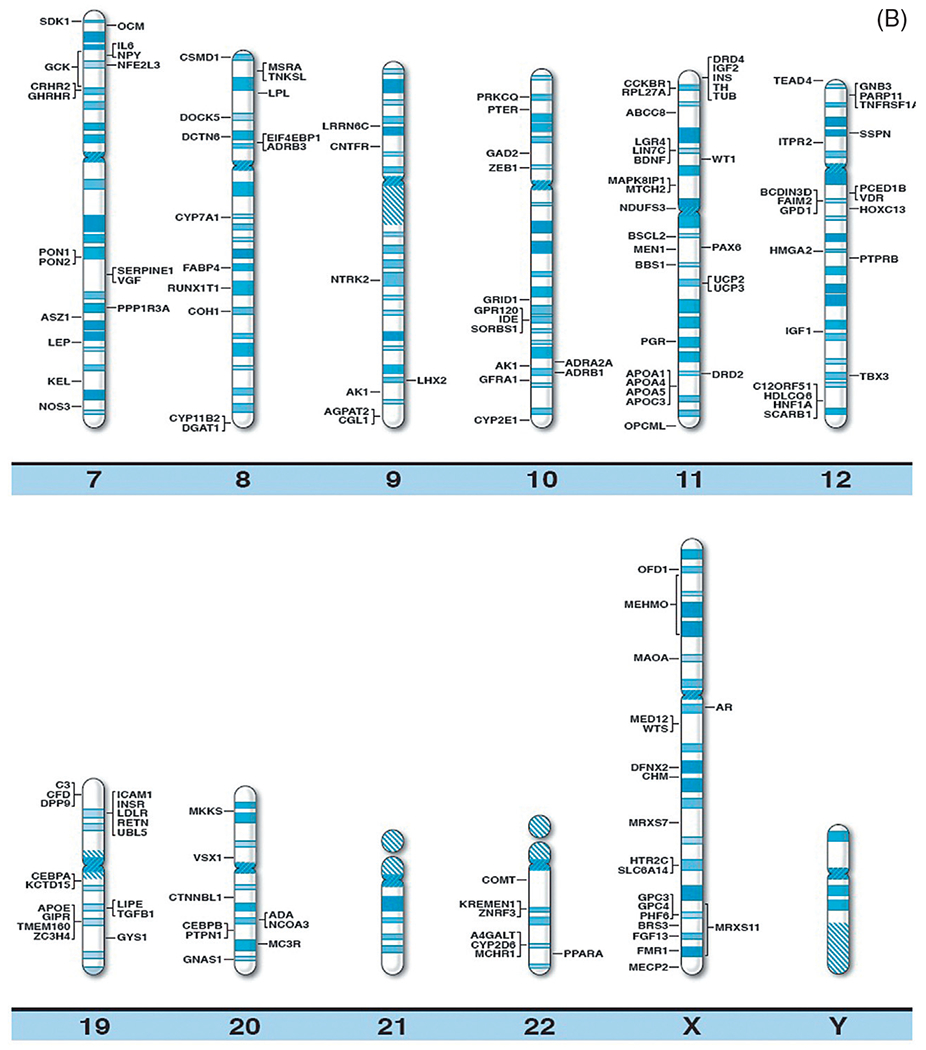
Figure 1.


(A) Obesity gene ideogram part A. High resolution human chromosome ideograms (850 band level) with symbols representing recognized genes for obesity positioned at the chromosome band location. The upper “p” and lower “q” arms for each chromosome are separated by the centromere area.16 (B) Obesity gene ideogram part B. High resolution human chromosome ideograms (850 band level) with symbols representing recognized genes for obesity positioned at the chromosome band location. The upper “p” and lower “q” arms for each chromosome are separated by the centromere area.16
