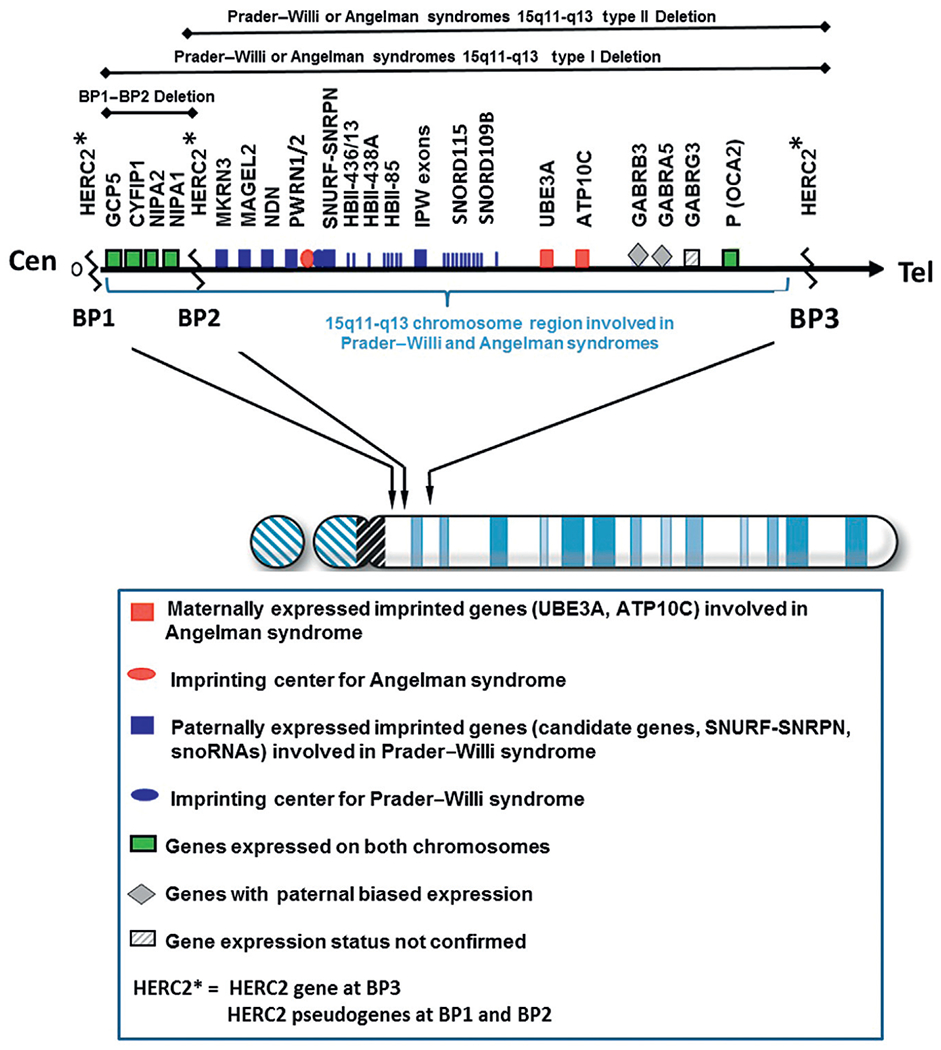
Figure 3.

Chromosome 15 ideogram showing the location of genes in the 15q11-q13 region. BP1, BP2, and BP3 are the three common chromosome 15 breakpoints in the region at the site of breakage leading to the larger typical Type I deletion between BP1 and BP3 and the smaller Type II deletion between BP2 and BP3. The dark gray (blue in the web version) colored rectangle-shaped symbols represent paternally expressed genes (eg, MAGEL2) which when disturbed leads to PWS. The gray (red in the web version) colored square-shaped symbols represent maternally expressed genes and the UBE3A gene when disturbed causes Angelman syndrome. The light gray (green in the web version) colored rectangle-shaped symbols represent genes (eg, CYFIP1) that are expressed on both the maternal and paternal chromosome 15s.
