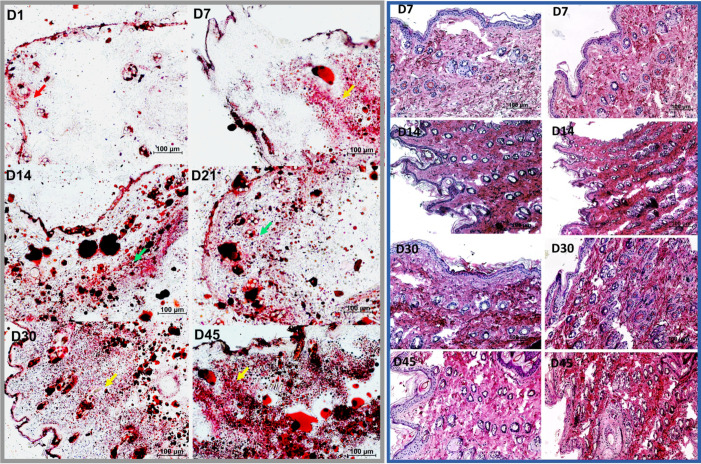
Fig 4. Grey box: Microscopic analysis of Oil Red O staining of frozen tissue sections derived from skin samples of the secondary lymphedema in-vivo model.
Representative stained samples from different timepoints are shown on the left. After induction, only isolated lipids stained on the dermis (red arrow). After day 7, fat deposition in the deep dermis was observed (orange arrow). During postoperative D14 (week 2) and D30 (week 4) fat deposition was detected systematically in deep and superficial dermis (green arrows). After D30 a strong diffuse dermal fat deposition was detected (yellow arrows). Scale bar 100μm. Magnification 100x. Blue box: Microscopic analysis of Hematoxylin & Eosin staining of paraffin sections derived from skin samples of the secondary lymphedema in-vivo model. Representative stained samples from different timepoints are shown. On the left side, skin samples from the left limb serve as control. On the right, the samples of the right extremity, with secondary lymphedema, are offered as comparison. Scale bar 100μm. Magnification 100x.

