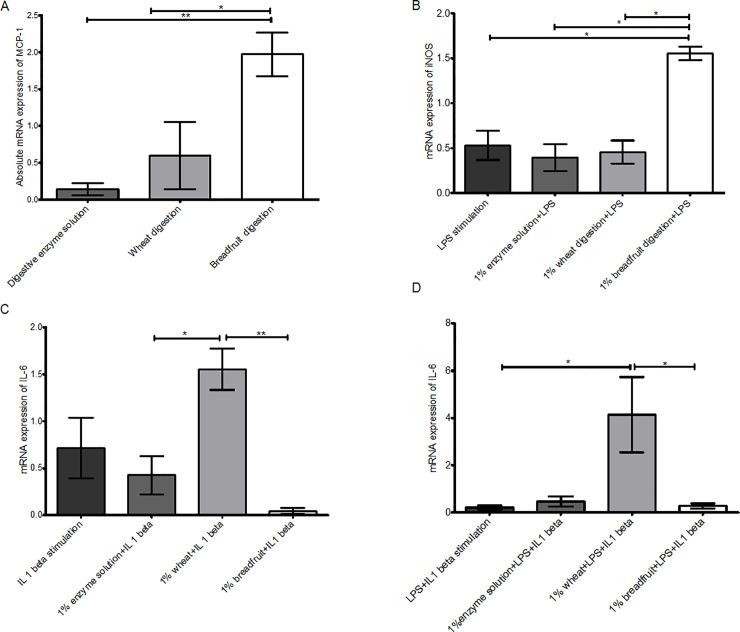
Fig 4. Cytokine responses of Caco-2 cells towards digestion treatments under different stimulations.
(A) non stimulated. (B) LPS stimulated (C) IL-1 beta stimulated (D) LPS plus IL 1 beta. Error bars represent the standard error of 3 replicates within each treatment. * represents significant difference at α = 0.05, ** represents significant difference at α = 0.01, *** represents significant difference at α = 0.001, using one-way ANOVA with Tukey-Kramer Honest Significant Difference (HSD) test.

